

Pearman Pulse – August 2019

IS BRANDING MAKING A COMEBACK?
Since Pearman started in 1996 we’ve seen many changes in the
advertising world;
- 1996: the internet was a few years old and just starting to gain momentum
- 2000’s: media consumption began to rapidly fragment
- 2010’s: advertising became captivated with Digital
- 2013: ‘Data’ started becoming the next big thing
Over these 20 or so years there has been a substantial shift in annual advertising budgets from Brand (long term marketing) to a direct response focus (short term marketing). This is driven by a significant shortening of marketing reporting cycles even though business leaders know short term focus is bad for business.
It now seems as though ‘Branding’ is making a comeback based on the recent Sydney Adweek. The Financial Times presented their ‘Importance of Branding’ study having interviewed 500 readers in the C-suite & marketing fields. While Mark Ritson’s talk was answering the question, ‘what drives effective branding?’ He reviewed around 6,000 Effie awards (https://www.effie.org/) to determine an answer. In addition, we have been hearing from our overseas contacts that more clients are talking about ‘Branding’.
The Financial Times research found 83% of business leaders believe Brands continually deliver to the bottom line. However they also pointed out that only 27% of company boards had ‘brand health’ as a KPI. Perhaps one of the biggest issues threatening Brands today is the job tenure of CEOs, CMOs and ad agencies as it is substantially shorter than years gone by. This means each brand is being looked after by many more custodians and it doesn’t take too much to pull a brand off course if people with differing ideas get in control.
Both the Financial Times and Ritson suggested companies ideally should have campaigns with two distinct advertising objectives – short term & long term. The short term objective (eg. sales uplift) covers the direct response and helps to fund the long term objective of building the brand (thereby helping long term sales growth, reduced price sensitivity, emotional connection, etc).
The studies also reinforced a Brand’s creative message is pivotal to the effectiveness of marketing communications campaigns. A company with consistent strong creative generates and holds customers going far beyond the functional benefits of the product to the emotional triggers (think Old Spice, “I’m on a horse”).
A company’s Brand is clearly worth a great deal with the Financial Times’ study showing ‘brand’ contributes 25% of most company’s intangible assets. Interestingly, over 80% of the market value of the S&P 500 businesses is made up of intangible assets such as Brand, Goodwill, Patents & future earnings. As an example, Apple has an approximate market value of $900 billion, with tangible assets (property, plant, equipment, etc) being $100 billion and intangible being $800 billion. Even with Apple’s enormous annual profit of around $60 billion there is no doubt a huge amount of Apple’s value is in their Brand, not just their future sales.
The Financial Times study addresses what they see as the Board-brand rift and “how business leaders have stopped building brands”. It is an interesting read and ends with recommendations for general management. Please let us know if you want a copy and we can send you the complete research.
WHAT'S NEW IN THE MEDIA - OUTDOOR

JCDECAUX
JCDecaux are trying to stop the Outdoor industry from giving over inflated discounts of 80-90% off market rate. They have recently finalized a complete overhaul of their digital large format assets which they vow will change the way agencies buy billboards. Their “market rate” cost for each site has been slashed based on a subjective quality and value of the site. Each site has a more realistic market rate and as a result discounts will become much more modest (around 8-12%). They plan to re-educate the industry and encourage media buyers to review sites and rates based on a cost per minute and cost per thousand metrics as opposed to inflated discounts. Beyond this, they have also reduced share of voice ad rotation from 1 in 10 advertisers, to 1 in 6, which they believe with increase viewability and total contacts by +67%. They will also implement category exclusivity for each billboard. This new way of trading will take effect from September 2019.
DIGITAL UPDATE
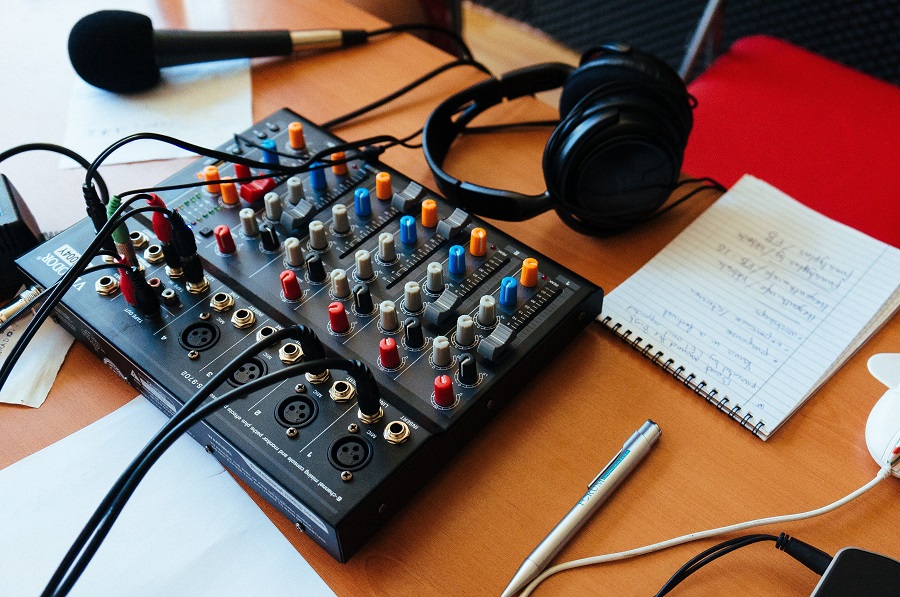
TO POD OR NOT TO PODCAST
In the past 2 weeks we’ve dived head first into the world of Podcasting. Seminars, meetings and our Head of Digital (Lex) even appeared in a podcast as a guest speaker, albeit on his favourite subject, Basketball.
Podcasting was previously know as “audioblogging” and dates back to the 1980s. Podcasts generally last for around 20 minutes to an hour and can be listened to when you’re connected to the internet or downloaded and listened to later.
Advertising opportunities on Podcasts are generally;
15/30 second ads: These appear mostly either at the beginning or during the podcast
Generous Host Read: a 1-5 minute long endorsement of the advertiser's product or service where the podcaster will create a narrative around their affinity with the product. Usually accompanied by sponsorship of the podcast.
Host Read: a 30 second live read by the host.
Podcasts can be made by anyone with a passion and a microphone which means there is a massive long tail of podcasts with an average of 30-50 listeners. However the commercially viable podcasts have 50-80 thousand listeners a podcast. (Such as Mammamia's suite of podcasts).
Around 1.7million Australian’s downloaded Podcasts in the last 4 weeks and they were predominantly aged 25-44. The major benefit for Podcasts are their ability to target particular audiences based on their content. From an advertiser point of view we need to ask what impact that alignment can make and is the cost worthwhile. Based on a cost to reach 1,000 people, a 30 second ad on a Podcast can be approximately 20-50x more expensive than reaching them on Radio. Besides cost, the other barrier is we cannot control when the advertising will be heard. Measurement of people listening whilst connected online is simple but it is much harder when the podcast is downloaded and listened to at a later date.
Podcasts are very much an “environment” buy and can be helpful for branding as long as the price is not prohibitive.
SMI UPDATE

Any hope of an advertising recovery in May & June has been obliterated by the latest interim July’19 expenditure data released yesterday. Jul’19 spend is down a whopping -17% compared to Jul’18, excluding late Digital and other bookings.
Even once those late bookings are included we are possibly looking at a decline of ad spend in excess of 10% for the month. The last time Australia had a double digit monthly decline was 7 years ago in Aug’12 when it was -11%.
All media have suffered greatly in Jul’19. The ‘interim’ declines for Jul’19 vs Jul’18 are TV (-10.7%), Digital (-31.5%), Outdoor (-16.5%), Radio (-11.2%), Newspapers (-16.1%), Magazines (-31.5%). Cinema bucked the trend with a 47.7% increase in ad spend for the month of July.
FAST FACTS

- 6pm News (on Seven or Nine) continues to regularly be the highest rating program on TV each night
- Google Maps (AR) – now literally puts you in the street as you walk along https://www.youtube.com/watch?v=3u9dt_WhsLI&feature=youtu.be&t=14
- Fathers Day 1st September: Australia has 4.6mil Dads (2.5mil should get socks & jocks as they have kids U18 at home)
- Is home ownership more difficult now than it was for your parents? In 1976 home ownership was 68.4%, in 2016 it was 67.1% (Census data)
- SBS has 9.1% audience share vs 7,9 & 10 but for BVOD they punch massively above their weight with a 32.8% share.

https://www.ceodaretocure.org.au/my-fundraising/donate/20/dominic-pearman
Pearman Pulse – July 2019
How much should I spend on Digital Advertising?
This is a question often heard from clients. Although prior to the arrival of Digital we were never asked how much should be spent on a particular media such as Radio, Print, TV, etc. Ideally, the question should simply be “how much should I spend on advertising”? However, to answer the specific Digital question, we have looked at Digital as four distinct budgets – Search (SEM), Online Classifieds, Optimising a website (SEO) and a ‘Display’ budget.
SEM seems to be a mandatory for the majority of clients and is effectively today’s equivalent of the Yellow Pages. As SEM directly relates to a specific search (albeit product name or category interest), clients should establish the ‘cost per acquisition’ (CPA) they are prepared to pay and limit spend on SEM to that CPA. The budget effectively sets itself. Interestingly, in days gone by Yellow Pages ads were predominantly booked direct by clients and didn’t come out of the Ad agency budget. As a guide, SEM presently accounts for close to 40% of all Online Advertising*.
Online Classified advertising relates to very specific sales sites such as cars, property, jobs, etc. If you are a retailer in those industries then Online Classified advertising is probably again mandatory. It is also likely that it could take up the vast majority of those clients’ budgets. Within the total Digital advertising spend, Online Classifieds makes up around 19%*.
SEO is a cost that arguably could be classified as part of the ‘Communications’ budget on a P&L as opposed to coming out of an advertising budget. Adjusting / optimising a website to rank higher naturally on Google searches seems more related to ‘communication to clients’ than brand building. The objective of SEO is to influence Google’s algorithms and open a window to the company, not to build a brand.
Within ‘Display’ we’re including Static, Video and Paid Social. The question of how much to spend on Display naturally changes from client to client. Some clients spend 100% of their budget on digital although they tend to be smaller clients with smaller advertising budgets. Looking at SMI Data** the Display activity for clients is sitting at around 20% of all advertising spend. This figure has grown at around 2% share each year for the last 10 years. For most clients with an ad budget greater than $500,000 it seems that 15-20% is the norm for Display. It must be stressed this is simply an average not a recommendation. The Industries** spending the highest proportion of their budgets in Display are Banking (around 30%+) and Insurance, Travel & Automotive who each spend approx. 25%.
Display Digital is just another media channel and should be treated on its merits like any other in terms of what it can arguably contribute for a client. Every medium needs to be measured and made accountable for what it does for a Brand, whether that’s lifting awareness and brand recognition, generating leads, increasing foot traffic, making sales or whatever the marketing strategy calls for. Unfortunately Online & Offline advertising is often sectioned off and looked after by different people or companies. It is no surprise that each person or company will most likely recommend a higher proportion of spend in the medium they know best. The best media plans will always be achieved from a holistic and unbiased overview of each and every media.
*Source: IAB Australia March 2019
**SMI: sourced from the major media buying agencies in Australia
WHAT’S NEW IN THE MEDIA – TELEVISION
Network 10
According to Rod Prosser (TEN’s Chief Sales Officer) – CBS are looking to use Australia as a “test bed” for new formats. We are being told programming will be more cohesive and should (famous last words) improve overall performance in terms of consistency and ratings.
New local content – My Life is Murder, One Born Every Minute, Sydney’s Crazy Rich Asians, The Amazing Race.
New overseas – Beecham House and Masked Singer.
Returning – Bachelor, Bachelorette, Survivor, Playing For Keeps, Trial By Kyle, Gogglebox, Pilot Week testing
Just on air now – Body Hack, Five Bedrooms, Taboo, & Kinnie.
Clearly TEN are maintaining their return to the under 50s target, something they did well for many years over a decade ago.
Now they need to deliver on programming, on audience and ultimately for the Network on revenue. We will be keeping a keen eye on the second half of 2019 to see what happens.
DIGITAL UPDATE

It’s School Holidays, but where are the kids?
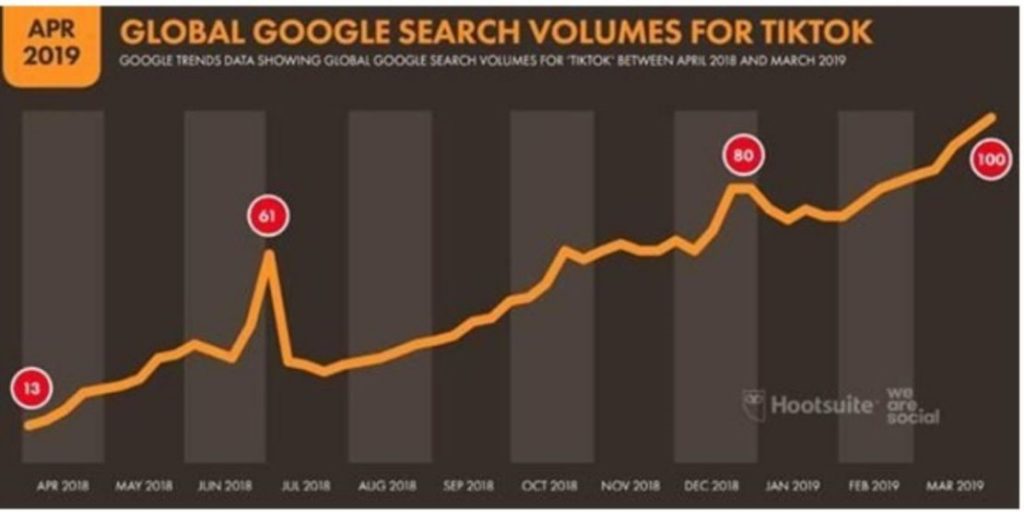
So it’s school holidays, and chances are instead of your kids being outside jumping in puddles, they are on their phones using their favourite app ‘Tik Tok’, the App formerly known as Musically. Essentially it is a video sharing app (user generated like YouTube used to be), where kids tape themselves being silly or generally showing off (often set to music) and broadcast it to their friends or to the world at large. If the consumer enjoys the content they can like, comment or befriend the user. Or they can swipe up and see how the next kid will entertain them.
The latest forecasts for Asia Pacific by market research group Forrester shows the popularity of TikTok is spreading with more than 700 million monthly active users globally. There are already 200 Million users alone in India (compared to 300 Million on Facebook). The app is currently available in 150 markets, in 75 languages, and has been ramping up its presence in Australia.
Other short-form video apps such as Vine have shut despite their popularity due to their failure to find a revenue stream. However TikTok managed to monetise it’s offering within one year of its launch through a variety of revenue models like in-app purchase of coins and virtual gifts, but advertising accounts for most of its revenue. Brands are increasingly collaborating with TikTok to reach younger consumers in Asia
Nielsen states that the platforms active users in Australia are at 67,000 in April. The App’s search volume* grows significantly during the school holidays, and although the minimum age is 13, the age gateway doesn’t require proof, so even your young kids (7-12yo) just need to download and sign-in to get on-board.
Like every new emerging platform, advertisers can engage with these audiences, by creating native ads and target audiences within the platform itself (self-service). Needless to say your ad (preferably video ad) needs to be entertaining enough so these Gen Z audiences don’t swipe up (ignore your advertisement and continue with their digital lives)
SMI UPDATE
The June’19 SMI figures are ‘hot off the press’ and enable us to compare FY19 to FY18. However, late Digital bookings still need to be added so the FY19 figures are somewhat under reported. FY19 also does not include Federal Government spend whilst FY18 does.
From Sep17-Aug18 SMI showed 12 consecutive months of increased advertising spend. On the other hand, the Oct18-Apr19 months were not kind to most media with declining advertising spend at around -5.5% per month. The good news is the May & June months seem to indicate some improvement in advertising spend.
Overall, if we assume $50mil of late Digital bookings and allow for past Federal Government spend, it is reasonable to say the FY19 total spend looks to be at least the same as FY18. In other words, the yearly advertising spend is relatively static – not decreasing or increasing to any degree.
One surprise in the figures is Outdoor has had a poor Jan-Jun19 period being down -1.5% for the six months. The Outdoor medium has grown for 9 consecutive years and still has the highest increase (+4.1%) of all media for FY19 but this is Outdoor’s lowest increase since FY14.
FAST FACTS
- 2GB is the No1. Station in Sydney at 14% share, however Smooth has 1,051,000 weekly listeners in the last week with 2GB having 677,000
- Magazines are still launching! Pac Mags launch “New Idea ROYALS” this month after Bauer launched “It’s Your Day” in June. Universal have also launched “Well Being Wild” and “Being”.
- New Large Format Digital posters are being erected outside Westfield Shopping centres managed by JCDecaux
- Ninja Warrior is holding it’s audience after a strong Monday night of just under 1.3M Nationally
- The US Federal Trade Commission has voted to fine Facebook around $US5 billion ($7.1 billion) over violations of previous commitments to protect user privacy
- Ebay.com.au is the top shopping website with 68,200,000 monthly visits and a high pages per view of 9.8.

Pearman Pulse - June 2019
AUSSIE, AUSSIE, AUSSIE, cOIn, cOIn, cOIn !!

It’s no secret that Free to Air (FTA) broadcasters lose money on televising sport. Australian sporting bodies have continued to balloon the costs they charge the Television Networks for the rights to air them, reaching a level that has now perhaps become unsustainable.
The AFL signed a $418 million per season deal from 2017–2022 with Seven & Foxtel, which marked an increase of 80% on their previous broadcasting deal. Seven also paid a whopping 80% increase for the rights to air the Cricket compared to the previous Nine deal. While Channel Nine’s latest contract with the NRL has seen a 70% increase on the previous arrangement and their Tennis deal was up 50% on what Seven previously paid.
The networks have shown a willingness to pay top dollar for sports rights as they provide a platform to cross promote their upcoming programs to a large audience. Sport also delivers high and consistent ratings that few other programs can guarantee and are believed to deliver a ratings ‘halo’ effect. One such event that consistently draws massive audiences is Nine’s State of Origin. Rugby League’s annual State against State rivalry has upheld audiences reminiscent of prime time television thirty years ago. Last year, Origin Game One was the highest rating program of the year with a national audience of 3.45 million. The first Origin game this year had a national audience of 3.2 million.
All these sports rights for the FTA networks have been possible due to the Government’s anti-siphoning laws prohibiting Foxtel from certain sports unless the FTA networks have the right to televise the events. However, it seems unclear if these laws affect the major Telco’s and Internet giants such as Amazon, Facebook, Apple, Twitter and Netflix. These companies pose a real threat to the FTA networks as they have tenfold the profit and can easily outbid them. This was evident when Optus outbid Fox Sports to secure the English Premier League for $60 million per season in 2016.
This threat is also apparent looking overseas as Amazon Prime outbid Sky Sports in the UK to secure the ATP Tennis broadcast rights and has now secured a small portion of the English Premier League with 20 matches per season. Australians love to watch their sport although it may become more costly for all of us in future years.
WHAT’S NEW IN THE MEDIA – OUTDOOR

MOVE invests $1.3m into the first phase of its digital measurement project
In 2010, MOVE revolutionised out of home audience measurement in Australia – at last we were able to tell advertisers a reach & frequency on their outdoor media plans and deliver some accountability to them.
Most recently, MOVE have now announced a further $1.3 million investment through a neuroscience project assessing audience engagement with digital and traditional out of home across formats, environments and travel modes. This will look at the increased impact and engagement of Digital out of home formats in a hope to further drive accountability of the Outdoor media
DIGITAL UPDATE
Apple driving user experience …. at the expense of Advertisers
At Apple’s 2019 Worldwide Developers Conference, they announced the launch of their own ‘single-sign-on’ function. This function is already being used by Google and Facebook allowing users to register to new apps by simply signing into their existing Google/Facebook accounts. Whilst this is a convenient solution for users, it also allows Google and Facebook to extract data and track users across multiple apps.
So what is the core difference of Apple’s single-sign-on scheme? Instead of collecting and sharing users’ data to developers and advertisers, Apple adheres to their Privacy Policy. They will protect and safeguard their data and utilise it to create a seamless user experience across all Apple products (iPhone, Safari, Apple Music and Apple TV). Hence, as Apple allows users to utilise their Apple IDs through their single-sign-on solution, they are muscling out Google and Facebook.
With Apple’s integration of authentication offerings through Face ID and Touch ID, it’s only a matter of time before the 8.6 million Australian iPhone users move to their single-sign-on function. Moreover, Apple intends to restrict data for advertisers by hiding user’s email addresses from third parties. Ultimately, making these iPhone users harder to reach through their emails.
This is not the first time Apple has attempted to knock out advertisers but is part of a broader privacy push in the past few years. In September 2017, Apple introduced Intelligent Tracking Prevention (ITP) on Safari internet browsers. The ITP blocks third parties from collecting information on users across the internet and has led to hundreds of millions of dollars lost for advertising firms.
Advertisers should stay on top of these privacy updates and the possible impacts it will have on their ability to communicate with potential customers. It has never been more vital for advertisers to continue to experiment in creative ways to produce useful, meaningful, and contextually relevant advertising messages.
SMI UPDATE
The April’19 SMI data makes it seven consecutive months of negative ad revenue and is down 10.3% compared to April’18. However it is important to acknowledge April’18 was an unusually good month due to the Financial Services Royal Commission and Commonwealth Games. On the other hand, April’19 did have an extended Easter period as well as election advertising.
The only two media to increase ad revenue this month were Newspapers and Radio. The increase in Newspapers (albeit small at 0.8%) is solely due to the Political Parties, Industry Associations and Unions category. While Radio (up 5.4%) can also thank the election for a decent month. Interestingly, comparing the Political Categories Media from 2016 to now, the mix shifted away from TV (down 16%) and into Radio (16.9%+), Digital (9.8%+) and Press (a strong 79% increase).
FAST FACTS
- Aladdin ($5.74M in the past week, $15.71M total in just 2 weeks) survives Godzilla ($2.65M) & Rocketman ($4.52M) to remain No.1
- Seven is again the #1 network in combined Channel Share in the current survey year-to-date.
- 2GB’s Alan Jones has proved he was worth the $8M for 2 years after dominating the Sydney market with 17.6% breakfast share, with ARN’s Kyle & Jackie O trailing behind on 11.8%. In Melbourne, Macquarie Media (3AW) also took out the top overall spot, with Smoothfm back in second place.
- iTunes will be officially replaced by Apple Music as part of the next MacOS update, which also includes Apple Podcasts and the Apple TV app.
- In terms of the highest number of monthly active users, Facebook dominates the market with Facebook Messenger, Facebook, Instagram, and WhatsApp Messenger all being the top 4 mobile apps
- However, the top ranking mobile app by revenue was Tinder followed by Neflix