
Pearman Pulse - December 2020

BVOD: COSTLY OR COST EFFECTIVE?

Broadcast Video On Demand (aka BVOD) is the most important growth area for Television Networks for both viewers and advertising revenue. As any business owner will tell you, it is essential to have multiple income streams and BVOD definitely gives the Networks an additional income stream.
BVOD is when you are watching a program online in your own time of choosing. It can be watched either live (via live streaming) or on-demand and is available on a computer, mobile device or connected TV. As opposed to the ‘FTA TV’ (Free To Air) viewing received via an aerial, satellite or cable, i.e. any TV that is not viewed over the internet.
There is no doubt BVOD viewing is going to continue to increase as consumers expect to view what they want when they want and internet connected TV usage continues to grow. Presently around 80% of Australians have a connected TV.
For the Networks, the digital connection ensures BVOD delivers far deeper audience data and effectively allows them to charge more for that audience. The BVOD audience is usually 2-3 times more expensive than a FTA TV audience based on a cost per thousand. While FTA TV is bought on an estimated audience, BVOD is bought on a per thousand targeted served or viewed impressions. BVOD also allows the Networks to compete in the digital landscape by selling the airtime “Programmatically” as well as on a direct buy. When buying programmatically we can also follow an audience across networks and platforms.
PwC estimates the 2020 BVOD advertising revenue will be around $200 million or 6% of the FTA TV revenue of $3 billion. There is definitely room for the BVOD revenue to grow as long as consumption grows.
The BVOD audience varies enormously from program to program and is not going to be popular for all programs such as News, ACA or The Project. BVOD tends to be popular for the “tent pole” 7-8.30pm programs. Some of the larger BVOD audiences of late include 129,000 for SAS and 106,000 for Home & Away. These figures represent 12% of their FTA TV audience. Around half the BVOD viewing is on connected TVs, 14% on a mobile and the rest (36%) is shared between a PC/Laptop and a tablet.
So, why would an advertiser want to pay 2-3 times more for an audience? Like all advertising, the value is in the impact an advertisement creates. As they say, not all impacts are equal and, in this case, a BVOD impact is greater than a FTA impact for the following reasons;
- it is “lean in” viewing – FTA tends to be “lean back”
- viewing device & specific program choice means greater engagement
- 75-100% are completed views, FTA does not have completed view data
- research says BVOD has twice the recall of FTA
Roy Morgan Research claims 80% of people watched FTA TV in last 7 days and 27% watched BVOD in the last 7 days. With BVOD delivering record ratings and revenue to the Networks those percentages are likely to be getting closer together. Perhaps the most telling figure that BVOD has a bright future is the audience heavily skews younger with 52% being under 39 whilst only 26% of FTA TV’s audience are under 39.
WHAT’S NEW IN MEDIA – NEWSPAPER PRINT READERSHIP IS UP!

The Jul-Sep20 Roy Morgan readership figures for Newspapers and Magazines have been released recently. Guess what – print readership is up! The big winners are the Sunday newspapers that are up a massive 22% in readership compare to a year ago. Interestingly they are also up 11% when comparing Sep20 quarter to Jun20 quarter. In other words, Covid to Covid. Across Australia, this translates to an additional 650,000 people reading the physical Sunday papers from a year ago.
The Weekend Australian and Saturday’s Financial Review have also had huge readership increases with around 260,000 additional people reading those papers. Across the nation, Mon-Fri newspaper readership is up around 5% except for Melbourne which has been affected by their lockdown.
Unfortunately printed Magazine readership didn’t do as well on a year on year comparison. However, from quarter to quarter, there were a number of successes in double digit readership increases. They include Womans Day, Marie Claire, Vogue, Elle, Frankie and Belle. Interestingly, in the midst of Covid Australians have turned to home improvements (Bunnings Mag is up 30.5%), cooking (Gourmet Traveller is up 64%), world events (Time is up 36%) and looking after their finances (Money is up 55%).
DIGITAL – THE RISE OF OMNICHANNEL RETAILING
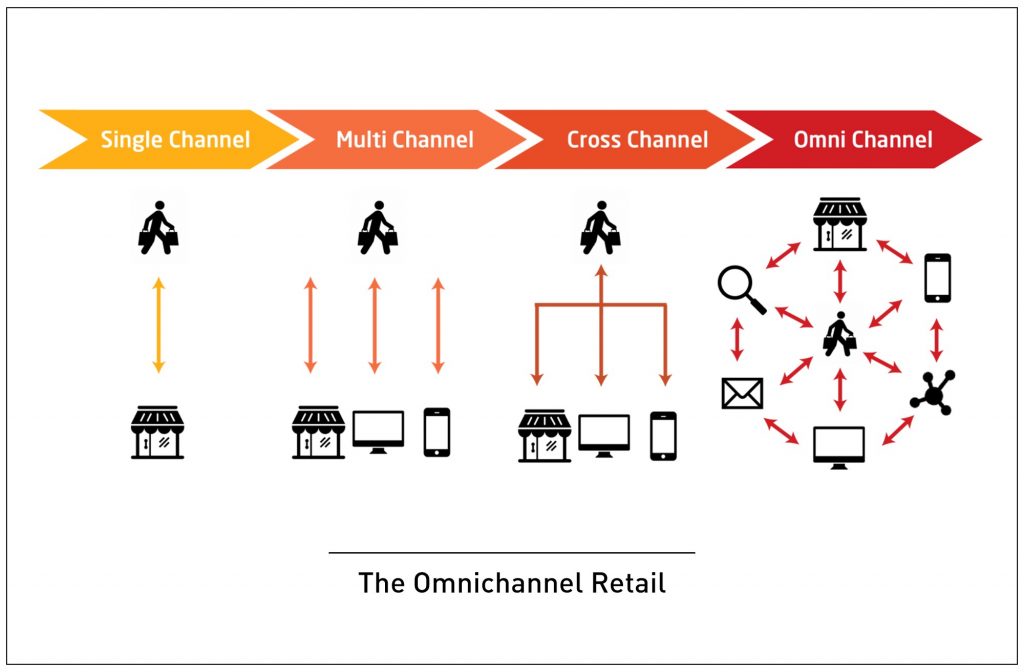
Firstly, what is Omnichannel retailing and why is it crucial for brands?
Every brand wants each individual customer to have a seamless experience and relevant messaging throughout their sales journey. An omnichannel customer experience is made up of individual customer touch points, over a variety of channels that seamlessly connect, allowing customers to pick up where they left off on one channel and continue the experience on another. An omni-channel experience accounts for each platform (website, blog, Facebook, Twitter, etc) and device (desktop, mobile, tablet, Apple Watch, etc) a customer will use to interact with the company. That knowledge is then used to deliver an integrated experience.
A good example is knowing a customer shops at a certain location and if a product is out of stock in that location you would not serve them an ad for that product. Or if a customer buys a particular product on a regular basis you would map out the appropriate time and creative to serve them an ad.
In a “multi-channel” environment (what most businesses invest in today), the customer has access to a variety of communication options that aren’t necessarily synchronized or connected.
Research shows customers that have had an Omnichannel retail experience are more loyal (up to 20% increase in return shopping trips) and more likely to recommend your brand to friends and family. In effect, they spend more!
Organising Omnichannel marketing will require working closely with several departments (Product, Marketing, Sales, Customer support, etc) in your company. The following is a good place to start;
- Collecting customer data: conduct brand studies, surveys, listen to social media comments and encourage customer feedback.
- Reviewing current interactions with customers: offering your clients multiple ways to shop and get in touch with you (website, social media, chat, in-person, call centre, app, sms, email etc…)
- Define a primary objective for each channel: research, shopping, interaction, feedback and make your experience optimal for the purpose you have chosen
- Review your tech stack and (most likely) invest in the right technology: select tools and platforms that can connect to each other easily and seamlessly.
- Cascade your learning cross-channel and have an always on test and learn process
While the transition from single channel to multi-channel towards omni-channel isn’t easy, 2020 has seen many businesses embracing the change. There is no doubt that 2021 will only increase customer demand towards greater centricity and personalisation.
SMI UPDATE – OCTOBER 2020
The October advertising spend figures are looking good at just 4.8% decline year on year. We appreciate declines are not great however this is the lowest decline in advertising spend since September 2019. Looking into November and December, SMI is suggesting that November could become the first positive month of advertising spend in two years.
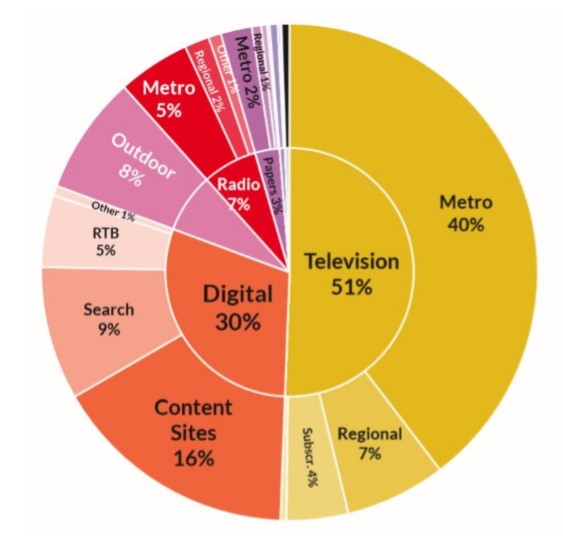
The categories that greatly helped October were the Food/Produce/Dairy (+42% YOY) and the Alcoholic Beverages (+47%) categories. No doubt moving the AFL and NRL finals into October encouraged those two categories to increase their spends. ‘Retail’ spend was also up 7% presumably the start of the pre-Christmas spend. Metro TV was the stand-out performer with a $32.6 million (15.7%) increase. Again, the sports finals would be a big factor in this. Digital was next best at -0.4% with the Social sites having a massive 45.5% increase whilst Programmatic reduced by -28.2%. Programmatic trading has eaten into Content Site bookings for many years, and now SMI suggests the trend seems to be reversing with the ongoing decline in Programmatic now seeing the value of Programmatic spend fall below that of Content Sites. Radio was down -17.1%, Newspapers -25.4%, Outdoor -46.5%, Magazines -51.5% and Cinema -91.3%.
FAST FACTS

- QR code (Quick Response) was invented in 1994 for the Japanese auto industry
- ‘X’ in Xmas is from the first letter of Christ in the Greek language (Χριστός)
- Patent for ‘barcodes’ was granted in 1952, borrowing elements from Morse code and movie soundtrack technologies
- Only 2% of the world’s population has green eyes
- Australian Domestic travel intentions have dropped 23% to 7.7million (Morgan Sep20)
- Each year, Australians spend approx. $400m on ‘un wanted gifts’ and most ends up in landfill

Everyone at Pearman wishes you a Merry Christmas and happy New Year!