

REALITY DATING SHOWS – Making A Fictional Series

Many of you may not be watching Married At First Sight (MAFS), however apparently lots of you are. What other reason would there be for Channel Nine to introduce another dating show? During the airing of MAFS, the audience is blessed with a glimpse of something new in the works – a casting call for a new show “Modern Dating”. This got us thinking, how many dating reality shows are out there? For Channel Nine we have Beauty and the Geek, Dating Naked (we’re not kidding – it’s on 9Now), MAFS, Talking Married, Love Island, and Naked Attraction. Meanwhile, Channel 7 had First Dates and Farmer Wants a Wife. Surely that’s plenty of dating shows right? Wrong! Channel 10 joins the party with The Bachelor and The Bachelorette and now has First Dates on 10 Play.
With so many reality dating shows now on Television, how are we to know how much of the content is scripted, and how much of it is actually reality? This topic always seems to be following many reality shows but in particular, Married at First Sight.
Presently in its 7th year on Australian Television, MAFS is the “social experiment” that follows the journey of 8 couples from their first meeting at the alter to the honeymoon and moving in together. As expected there is drama a plenty which naturally attracts the audience. As Australia watches how quickly a relationship can fail it reminds us how difficult it is to look away from a car crash and how we are drawn to the destruction … in this case of a relationship.
For those of you that aren’t keeping up (and for those of you that are), we have just finished Intimacy Week – a week in which we are trying to hide our shocked expressions while we internally question the classification of this prime-time show. Excuse me for being shocked to see a naked man doing a handstand while in the shower. Surely, he was not forced to do that. Although this is the same guy that refuses to kiss his bride in front of the camera crew as he claims that this is too intimate an act.
MAFS has a success rate of less than 7% with only 5 couples staying together out of the 72 that have been matched over the 9 seasons. However it has been a big success for Nine despite a slow decline in the Free To Air audience. On average, MAFS is the most watched dating show, with Farmer Wants a Wife, The Bachelor and The Bachelorette following behind. Perhaps the dating show genre is a bit like the relationships they manufacture – that is, difficult to keep going. In 2019, MAFS reached a national average audience of 1.86 million, in 2020, 1.59 million and in 2021 it dropped to 1.42 million. Currently, the 2022 season is reaching approximately 1.31 million people each night. However this is still a great success for Nine as it is usually the 5th highest rating program most nights it appears (behind the News programs) and is easily the highest rating program for people under 55. It’s important to keep in mind that Nine also benefits enormously from the BVOD audience which is huge for MAFS. It is the No.1 rating BVOD program and adds a huge 450,000+ audience to the nightly MAFS figures above.
The shows also produce major talkability on social media. Every night, many are battling it out to have their opinion be heard. Is this why these shows are remaining relevant despite many questioning the possibility of these shows being scripted? Among these opinions is speculation that many of the contestants are actors or at the very least, Instagram influencers, who are only on the show to boost their following. Regardless of this, we continue to watch anyway.
Reality dating shows, are they fiction or fact? We think the real question is does it matter? These shows provide us with entertainment, laughter, a great conversation starter, viable audience projections, and a slither of hope that love at first sight can work. What more could we want?
WHAT’S NEW IN MEDIA – IS SVOD LEVELLING OUT?

The advance Morgan Research figures tell us that, overall, the big five Australian streaming services (SVOD), Netflix / Binge / Stan / Disney and Amazon, have significantly slowed their viewing growth in terms of Unique Viewers (not the amount or frequency of viewing). The growth has slowed to close to half from +24.28% a year ago to 13.52% to December 2021. This suggests a maturing in consumer demand and suggests a plateau sometime this 2022 year, especially as both these two years were largely Covid years. WFH has been a benefit to any Media that can be consumed online but perhaps especially SVOD.
Why would we analyse this (you might ask) when Advertisers cannot buy this audience on these platforms?
Simply because viewers are just that, there are only so many minutes of video/program content the average person can consume. If SVOD is increasing, then it is logically taking viewer minutes away from FTA TV, BVOD or from other Media.
Decades ago we made a first whole of market analysis to calculate the average adult 18+ potential media consumption time in a week. This was approximately 54 hours of media content actively or passively consumed (passive, think for example most Out Of Home). This has not varied by more than an hour, with perhaps the exception of Covid years 2020 & 2021.
Therefore a plateauing of SVOD could and should be good for FTA TV and/or BVOD, as it holds the gradual creep of SVOD audience which is quite noticeable post 9pm each night.
Albeit early in the 2022 Programming season, there are signs that more post 9pm FTA TV programs are succeeding or at least rating better than previously. The other good news for 7, 9 and 10 are their BVOD audiences have grown on average around 26%. Maybe some of this growth was from the market leader, ABC iView, who went backwards in 2021.
SVOD is in an increasingly crowded and competitive sector fighting for the consumers dollars. It now has the growth of BVOD to contend with which again puts pressure on that finite media consumption time that we all have available each week.
DIGITAL – ‘ZAP’ … SAVES YOUR TIME & INCREASES PRODUCTIVITY!
The “Big Data” fascination really got going in 2010 and since then technology has continued to advance. Many of the traditional large companies have that much data and data sources that it becomes a headache to manage. Linking all the data together can be a mammoth job.
One product to help manage that data overload is Zapier. It passes data between your digital platforms (Facebook ads, LinkedIn ads, Google Ads, etc.) and CRM automatically, which ultimately increases your workflow, time management and accuracy. A “Zap” is how Zapier initiates this passing of data. A zap consists of:
- A trigger – every time an event happens, a Zap runs automatically. For example, any time I get a new lead on Facebook.
- An action – the task you want Zapier to do for you. It can send you an email as soon as someone fills out a lead generation form on Facebook
- Zapier can connect many popular platforms and apps such as Facebook, Google, Slack, Salesforce etc.
This enables you to automate processes without having to create the integration yourself or without hiring someone to implement this integration for you. So why is this such an important tool? In a word, efficiency. This process alone can save many hours of data entry, reporting and updating important CRM platforms. The ability to bypass any human interference is important, as human error can slow down productivity and could prove costly if something (i.e. Facebook leads) is missing. It also helps sales team to act promptly and convert leads to customers quickly. Zapier frees up more time to focus on partnerships and customer relations instead of spending too much time on various online platforms. Lastly, the creation of a zap only takes a few minutes, which is a massive time-saver in the long run and once it is on, it runs until you turn it off so there is no ongoing maintenance for every Zap you create.
Zapier offers a free version but has plans starting at $28 AUD a month and more, depending on how many Zaps you need to set up. If you want further information about ‘being zapped’, please email Luke at lbrann@pearman.com.au
SMI UPDATE – JANUARY 2022
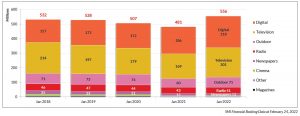
Advertising spend through Australia’s Media Agencies continues the strong growth pattern from last year. The January spend of $555.6 million is 15.4% up Jan’21 and is still +5.1% ahead of the pre-Covid January 2019 total. The Jul21-Jan22 period is 16.1% up year on year and has for the first time the surpassed $5 billion mark. This is a great start as 2021 was up 6.8% on 2019 and we’ve started 2022 with a large increase on 2021. However, it should be noted Jan22 had the Australian Open in it while in 2021 the AO was in February.
It feels like a broken record, but the Government spend has once again supported much of the growth. It accounts for 23% of the additional spend and the Government increased its year-on-year January spend by 51%, spending $51m in Jan’22. It is a safe bet that these increases will continue until April’22. Other categories to increase by +30% were Insurance, Home Furnishing/Appliances and Communications. Automotive was the disappointment for the month as its spend declined -18.2% compared to Jan’21. Healthcare was another category that reduced spend substantially spending $11million less that last January.
Television and Digital were again the star performers of the month. Television increased 18.9% and this can be expected to continue throughout February and March. Trying to buy advertising space on TV any time soon is a very difficult task. Digital increased by 18.7% with Social Media reporting the strongest growth of any Digital sector. Outdoor continued to get ‘back to normal’ Cinema had a good start to the year with an 81.1% increase although it was off a small base. January 2022 was a little disappointing for Radio (-0.1%), Newspapers (-8.6%) and Magazines (-6.5%) as they all had reduced spend. The Newspapers and Magazines SMI data now includes their digital spends within the Medium.
FAST FACTS

- The average cost of a 30sec TVC in the Super Bowl was around $8.9million AUD
- Australia has recorded 5,200+ deaths from COVID-19 since the pandemic began however, it is estimated that the nation has recorded 12,881 fewer deaths from all causes over the last two years than would normally have occurred.
- The average cost of a 30sec TVC in the Super Bowl was around $8.9million AUD
- In 2021, Australia was ranked the 12th happiest country in the world, New Zealand came in at No.9. Finland was No.1 for the fourth year in a row.
- The ABS Retail sales figures for January 2022 are up 5.84%
- Readership for Taste Magazine is up +48.4% in the last year