
SWIRLING WINDS OF CHANGE – WHAT WILL BE THE 2022 REVENUE MARKET?
This month, Steve Allen gives his forecasts for media spend in 2022. Steve is certainly well placed to make forecasts as he has been doing it for 30+ years.
Here goes… a month or so ago, it seemed smooth sailing might be the case in 2022, for the Economy and for Media Marketing. But unfortunately … no longer.
In that small space in time all kinds of headwinds have formed.
- first we had the Omicron outbreak, and its fast spreading nature
- then the flow on supply chain disruptions
- the RAT test debacle
- the Supermarket & retail supply and shortage issues
- the outbreak of inflation
- the Consumer confidence read
- Business confidence fell sharply in December
- now an apparent major share market correction seemingly occurring
We think the poor consumer confidence read in mid January, was the result of an unusual convergence of factors, unlikely to be sustainably repeated. More than anything, we think the Consumer is just tired and frustrated with the uncertainty and restrictions Covid has placed upon us. This, we believe will continue to weigh on consumer confidence, however we also see skittishness in the coming weeks, not a sustained or increasing fall. Our read of consumer confidence is that it is presently quite reactive, therefore volatile, rather than spiralling down into a morass of negativity.
This makes forecasting for 2022 Media Markets more hazardous than ever.
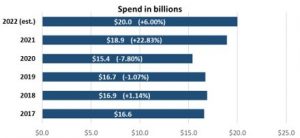
Never-the-less we developed and modelled where we believe the 2022 market will pan out at the beginning of Q4 2021. We forecast then an overall growth in Media Marketing dollars of 7.25% to total A$20.26b
Factoring in the headwinds, we now believe the market will only grow by 6.0% to total $20b. This is remarkable, a far more rapid recovery than expected in 2021 and continuing in 2022. This places 2022 all but 20% ahead of the last covid free year of 2019.
Below is the total spend (inc. all Digital and more than just media agencies) that is spent on advertising for the past 5 years.
All of this forecast 2022 growth is pretty much within Internet (other Mediums, some up some down, a mix)
Over the past few days, some commentators are taking a much more bearish view, suggesting or inferring, the wheels might fall of both the economy, and flow on to Marketing. The fear is Central Banks reaction to inflation (raising interest rates to stem inflation outbreak, and then the flow on effect to Mortgages & debt, restricting consumers spending, and ultimately the mood and confidence, leading to a downwards spiral).
We do not believe Australia is facing such a precipice. We believe the fundamentals of the Economy are sound and not likely to dramatically deteriorate. Hence our modest adjustment to our 2022 forecast, most of which is likely to be experienced in Q1 2022.
Most of the Media Agency market is measured by SMI (Standard Media Index) and this also gives us a feel for forward bookings. Media pacing (as it is called), shows a very similar pattern to non-Covid years, plus many Marketers are planning around the expected Australian Government election, forecast for May. Thus whilst we are cautious, we are cautiously optimistic!
Most media will grow in 2022 on 2021… some still making up lost ground; Radio, Outdoor, Cinema, & Magazines. Internet will continue to both dominate and distort as it is forecast by us to comprise over 65% of the Media Market.
Footnote: There is no truth in the rumour that the World’s Annual Psychic conference has been cancelled due to unforeseen circumstances!
WHAT’S NEW IN MEDIA – RADIO AUDIENCE MEASUREMENT
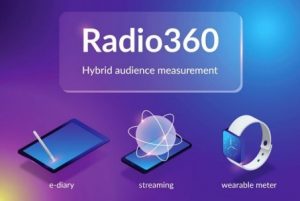
The Radio industry is changing the way they measure their audience and have launched a hybrid audience measurement called Radio 360. This will oversee a transition from paper surveys to the majority use of e-diaries and integrate live streaming data to provide more information on the size and profile of audiences listening across digital platforms.
For 70+ years, Radio audience measurement has been reliant on people filling out a manual diary where respondents (over 10yrs old) tick boxes for every 15 minutes of the day for a 7 day period, so long as they have listened for 8 of the 15 minutes. This is a fairly cumbersome way of getting ratings both from the respondents completing it and the researchers (GFK) who have to find people and then collect the results. There is an annual sample size of around 60,000 surveys.
Covid has driven the digital measurement and hastened the new hybrid measurement system – Radio 360. At the end of 2021, 50% of the surveys were e-diaries and by mid this year the majority is expected to be ‘e-diaries’. In essence there is not a lot of data difference between a paper diary and an e-diary except one uses a keyboard. There will also be an additional 2,000 people with ‘wearable meters’ (think watch). These watch-like devices will pick up listening on all devices but not if people are using headphones. The wearable meters will be a sense check and provide validation against the e-diaries which still rely on people remembering what they listened to and for how long. Down the track the wearable meters could also be used as a qualitative platform for particular research projects.
The most exciting aspect of future Radio measurement is the capture of streaming data. This will deliver far richer and deeper audience insights and is expected to be released as a sub-set of data alongside the usual 8 surveys a year. The first streaming data measurement is expected around July 2022. This will help bring Radio into the realm of how a great deal of today’s media is bought based on a cost per thousand delivery based on a particular data set.
The latest SMI data shows Digital Radio ad revenue growing by 44% and 37% over the last two years and accounting for 8% of total revenue. Clearly it is becoming more important for the Radio industry to measure all forms of digital listening for music, talk and podcasts and across all devices.
DIGITAL – PARADISE BY THE DIGITAL DASHBOARD
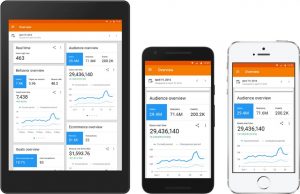
‘Paradise by the Dashboard Light’ may be an epic 1977 seduction song by Meatloaf however, 45 years later in 2022 there is an even a better way to get excited by Dashboards. It’s the Digital Dashboards that really can deliver paradise by shining light on your digital campaigns.
When it comes to delivering real-time and accurate digital results to a client, it is impossible to trump a well organised and well customised dashboard because let’s face it, it’s more engaging than looking at another Excel spreadsheet pivot table! A dashboard is a tool that can collect and organise data from multiple different sources such as Facebook, LinkedIn, and Google ads, and shows a campaign’s performance all in one place, making it easier to compare data from any time period, and can be accessed on most devices, such as a computers or a mobile phones.
The dashboard allows a client to make important decisions on the fly, as they can see results in real-time, and having the ability to check these results at any given time gives all parties a clear path to optimise the campaign moving forward without any extra time spent on campaign updates. The biggest positive of using a tool like this is the ability to customise and constantly update metrics, charts, or graphs to the client’s preference, making sure all KPI’s are represented and nothing is hidden. Above all, it offers transparency, which ensures the work being done is always being held accountable. There is no doubt a dashboard delivers that extra peace of mind and allows you to “sleep on it” (you may need to listen to the song).
SMI UPDATE – JAN-DEC 2021
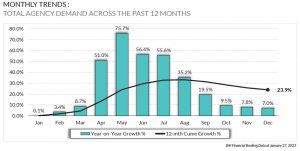
The ad market’s 2021 ad spend of $8.6 billion is +$1.6bn on 2020 and +$550m on 2019. It was expected that the 2021 year would have much greater advertising spend than the heavily impacted Covid year of 2020. It was up 23.9%, however, what is a surprise is that the 2021 spend was even up +6.8% on the 2019 figures. In the last 10 years the media agency spend (measured by SMI) has tended to increase by around 2% per annum. So 2021 has definitely been a healthy year for ad spend. The year ended with the December bookings of $710 million being 7.1% up on last year’s December.
The Government category roared up the expenditure charts to become the second largest category for 2021 with a massive 106% increase on 2020. Government spent $614 million which was still $34 million more than their combined spend of 2019 and 2020. The biggest category of Retail was only up 1.7% however it also did not have a huge fall in 2020 spend as many of the other top 10 categories had. Auto was disappointing with a 2.4% increase on 2020 as it was still -28.5% on its 2019 spend. The Insurance category was the fourth highest category with an impressive 23.4% increase on 2020 and well up on 2019 spends. The Travel category increased spend by 40.5% in 2021 but was still understandably down 35% ($155 million) on 2019.
All media had increased ad spend in 2021 compared to 2020 albeit at varying levels of increase. Television and Digital make up close to 75% of all SMI spend and they both received more than their 2019 ad spend. Digital was the star performer and was up 35.4% on 2020 while Television was up 19% on 2020. Outdoor was up 26.8%, Radio up 18.9%, Newspapers +2.5%, Magazines +4.2% and Cinema was up 61.3% although still 46% down on 2019.
FAST FACTS

- The 2022 AO Women’s final delivered a national audience peak of 4.3m making it one of the most popular sporting moments of the last 20 years
- I n FY21, immigration to Australia fell 71% to 145,800 from 506,900 arrivals in FY20
- Elvis had an identical twin brother who died at birth
- Australians spend an average of $2,776 per year via e-commerce, well above the global average of $1,435 (Hootsuite study)
- Australia has the world’s longest golf course – the Nullarbor Links at 850 miles
- An Uber delivered large Cappuccino costs $8 – for those in ISO