

Getting The Green Light - June 2022
JUNE 2022

GETTING THE GREEN LIGHT
One could argue that the most important and effective brand message across all media platforms in the past year has been “We are sustainable and we care about climate change”. There is no doubt that climate change has increasingly become a front of mind issue for the Australian public, especially given the prevalence of major disastrous weather events across the country over the past few years. Google’s Year in Search 2021 stated that the terms “sustainability” and “impact of climate” were searched more than ever before.
One need only look at the most recent election results in which Labor’s successful campaign (or Liberal’s loss) addressed climate action. All Parties who had positive and progressive green policies, particularly Climate change were successful. The “ Teal Independents”, borne out of the Climate 200 conference, won 10 seats across the country and the Greens picked up an additional 3 seats. What used to be treated as a secondary concern for a lot of people has quickly become the deciding factor in who they vote for. Roy Morgan found the biggest issue that sunk the Morrison Government was their failure to articulate a clear (& believable) Climate policy. This was followed by their failure to pass legislation for a Corruption Commission and their response to concerns that women were expressing.
Australia’s largest brands and media providers have jumped on this trend early and have already begun to build their entire branding around wanting to be perceived as sustainable. Both Woolworths and Suncorp Bank’s latest campaigns have leaned heavily into climate change imagery and have rebranded themselves as the “green” options in their respective fields, with both brands making commitments to using 100% renewable electricity in their operations and stores by 2025. VB even went a step further, launching the “Solar Exchange” in which it allowed customers to exchange $30 of excess solar energy for a slab of its beer.
Conversely, companies who are seen to be harming the environment are experiencing swift backlash. AGL has long been criticized for being among the worst polluters in Australia and when they invited Agencies to pitch for the business in May, Greenpeace issued a statement warning the media that “Ad agencies who work with AGL are complicit in rolling the turd in glitter” and that they “will face increasing reputational pressure if they align with this company.”
Advertisers understand that the modern consumer will actively choose brands who are seen to take stands on social issues and according to the 2021 Meaningful Brands Study, more than half of consumers are willing to pay more for a brand that takes a stand. This sentiment was echoed in Nine’s State of the Nation presentation on sustainability in which they stated that nearly three quarters of Australians say that the benefits of taking further action on climate change will outweigh the costs.
Going forward, expect brands and media companies to become even more outspoken about their sustainability efforts and for it to become a part of almost all brands identities. Whilst there remains the legitimate concern of “greenwashing” by larger corporations, Australian’s will continue to back trusted brands who are seen to be legitimately taking a stand on the issues of sustainability and climate change.
WHAT’S NEW IN MEDIA – MAGAZINES MAKING A COMEBACK?

Magazines had the roughest time of all media in 2020 with their advertising revenue declining -43%. This was 20% larger than Outdoors’ decline (-36%) and 87% larger than Newspapers’ 2020 decline of -23%. Bauer Media (now ‘Are Media’) closed 8 magazines - Harper's Bazaar, Elle, Men's Health, Women's Health, InStyle, Good Health, NW and OK. Many of these magazines had expensive global licenses attached to them which would have contributed to their demise. Even though it seems there was consumer demand for the 8 deleted magazines (they were read by around 1.2 million people), clearly, they were not able to be profitable. The cancelled or suspended titles made up around $10million of the initial $40+million drop in ad revenue. The habitual habit of purchasing at Newsstands was also severely disrupted during 2020 and has not returned to previous levels and is unlikely it ever will.
There are however quite a few signs of life in the Magazine marketplace and around half of the Internationals have now returned in one way or another, via independent Publishers - Harpers Bazaar, InStyle, Women’s Health & Men’s Health to name some. SMI data shows advertising in printed Magazines for Jan-Mar’22 has increased 4.3% compared to the same time last year. This has been driven by Travel, Clothing, Automotive and Fashion clients. However, Apr’22 SMI has not been a good month for Mags.
Readership has remained relatively stable with Morgan Readership data to March 21 showing the top 35 paid cover titles (excluding those cancelled or paused) increasing gross average issue readership marginally by 0.95%. There was a small drop to March 22 to finish a two-year trend at -0.23%. Some sub-categories had solid increases such as titles covering Homes & Gardens, Food and Automotive.
So what are you waiting for? Stop looking at Facebook, buy a coffee, get a magazine and escape for an hour or two.
DIGITAL – TIPS FOR DIGITAL CREATIVE

Tip 1: Test & learn
Testing creative formats means trialing the effectiveness of ‘Video’, ‘Static images’ or ‘Carousel’ ad formats. No matter what stage of the marketing funnel (awareness, consideration, conversion) you’re advertising is in, the creative should be tailored to the type of campaign you are running. If you are running an awareness campaign, educating your audience and creating demand are the most important things to keep in mind when selecting an ad type. Video ads work well to create awareness, as they can educate the audience in a short space of time. For conversions, a single image or GIF creative with a call-to-action help inspire the audience to purchase. However, a test & learn approach is recommended as there are no guarantees as to which creative will work best.
Tip 2: Be careful in refreshing creative
Each time Facebook gets an ad there are three distinct phases. 1. Review - where Facebook checks your creative adheres to their guidelines 2. Learning - algorithms are determining what works best for your objectives 3. Active – the ad is running at peak ability. Making any changes to an ad or who you are targeting will put whatever you’ve changed into the “Review / Learning phase” which potentially puts the Active phase back hours or days. It is important to make sure that you’re not changing creatives too often as it can slow the results down. You should however have a different message for prospecting compared to retargeting.
Tip 3: Creative design tips
When it comes to creating ads, it is important to consider how well the ad will blend into your organic posting. If it feels similar to your brand’s style and voice, it will come across as more authentic. Include ads with minimal text on the creative itself, as Facebook suggests that images with less than 20% text perform better. With Video ads, ideally use a horizontal video with a square format, coloured background, large headline, and subtitles below the video. A square canvas will take up the optimal space on the Facebook feed, particularly when viewed on a mobile. Usually, the shorter the better for Video ads (maximum 30 seconds)
SMI UPDATE – APRIL 2022

Australia’s media Agency market has reported its 16th consecutive month of growth in April, with the value of total media investment lifting 5.5% to $639.0 million to also ensure a record level of bookings for the first four months of 2022. There’s also a record level of ad spend being reported for the ten months of the financial year, with the market moving beyond $7 billion for the first time in this period after growing total media investment by 13.7% to $7.02 billion.
April 22 is probably the last month (for the next couple of years) that ‘Government’ spend will feature so prominently, it was up 83.5% to $53.8 mil. Without Government spend the ad market would not look as strong however it was pleasing to see Retail with a solid 10.7% growth in spend in April. Retail is the largest SMI category making up 11% of the total ad market and this month was its largest increase for the past 9 months. Automotive is the 2nd largest category and was again down -11% in April. The last increase Auto had was in August’21. Once Auto recovers it will replace the hole (along with Retail) that will presumably occur with the reduction of Government spending. The odds of the ‘Gambling’ category increasing look good as the past two months has seen a +5% (Mar’22) and +11.9% (Apr’22).
Outdoor had a strong month with a 16.7% increase vs Apr21. Cinema had a huge increase of 126.9% albeit from a low base in Apr21. Newspapers also had a good month, presumably due to the election, with a +9.1% increase across print and digital. Television was static and Digital increased 9.3%. Radio increased +7.5% including their Digital spend. Magazines did not have a great month and were down -21.6% across their printed and digital versions.
FAST FACTS

1. We celebrate the Queens Birthday in June – her real birthday is 21st April
2. People visiting Cinema is up +76.6% (Morgan Mar’22, qtr vs qtr)
3. Pigs do not sweat so the phrase ‘sweats like a pig’ is incorrect
4. The Great Ocean Road is the world’s largest war memorial
5. Recent droughts in Europe were the worst in 2,100 years
6. Australia’s Electoral Act doesn't actually require truth in electoral advertising – eg. Clive’s 3% interest rate cap.

May The Fourth be With You - May 2022

MAY THE FOURTH BE WITH YOU

As Luke Skywalker was urged to trust the Force, so to is Trust (or Distrust) omnipresent in the advertising business. We work in an Industry where trust is a prime currency and a lot of this is granted…or taken for granted! We don’t often think about it. In 2021, SMI says $8.6 billion was put through the Media Agency Industry of which a large amount is conducted via phone or Email – all done on trust. To a large extent, the Media sub-contract all financial risk to Media Agencies, because of the conditions and qualifications of Media Accreditation. Never-the-less each one of us are earning Trust or Distrust through our interaction with the Media. What we do, how we communicate, how we say it, how truthful, transparent and forthright we are, and in observing protocols and deadlines. Decades ago, trust was where most everything was done under the guise of your word is your bond. As most books about the history of Advertising attest, historically verbal agreements were the currency. However the dollars at stake are far greater today.
Beyond this is the much bigger field of consumer based trust and distrust, in services, in brands and their owners.
Morgan Research have been tracking this comprehensively for 4 years since 2019, (in the case of Government partially for 15 years, since 2007). Morgan now conduct a great quarterly presentation of their analysis of findings, trends and rankings.
As Morgan point out, a lot of Clients and Marketing people use Net Promoter Scores, as a yardstick of Brand standing with Consumers, positive consumer scores minus negative = NPS. The issue there is it is simplistic and often done in a silo not taking into account the underlying trends or competitor comparisons. Today (perhaps for ever) the most important trend line is those who Trust or Distrust the Brand or service (or person/personality).
During the past two years of Covid, really significant changes in rankings have occurred. Supermarkets trended upwards and scored heavily and positively due to their responsiveness. They adapted to challenging conditions and various Governments regulations, primarily concerning how to handle Covid and the often resultant panic buying.
For an entirely different reason, Banks have trended upwardly in past two years, post the 2017 Royal Commission into Banking. They largely took the findings and were given the opportunity through Covid, Fires and Floods, to mend their ways and treat their customer/clients with greater care and respect.
Conversely, those whom have not handled their interaction and social responsibility well with the public, have suffered huge reversals, AMP and Rio Tinto the outstanding examples, but many more have changed score and ranking.
Trust and Distrust scores plus trajectory through tracking and trending, are today THE new currency for Brand health, success and longevity.
WHAT’S NEW IN MEDIA – AFL TV RIGHTS UP FOR GRABS

Late 2021 saw Ch9 and Foxtel secure the NRL TV rights worth $400 million per year for the next 5 years, also on the cards right now is the TV rights for the AFL. They are worth a staggering $470 million per year and Ch7 have held the rights exclusively for the past 10 years on Free TV.
As it stands Seven holds the broadcast rights and Foxtel Group the pay TV, which is spread across both Foxtel broadcast and its streaming platform Kayo. Although there was a two-year extension agreed during the pandemic, the last time the rights were properly negotiated was in 2015. It was a deal worth $2.5bn for six years. Most of the money came from Foxtel, with owner News Corp infuriated at being blindsided by NRL doing a deal with Nine.
Despite the fact it’s almost a certainty as a guaranteed loss, the networks can’t pass up such a draw card ratings winner. It’ no surprise the bidding war has commenced from major networks for a 5-year deal from 2024.
However, there is another factor at play here in that Ch10, who was largely discounted over previous bids on AFL rights is in a much stronger position with support from its parent company (Paramount).
Seven knows that losing the AFL will spell disaster as it was for Ch10 when they moved away from the AFL shared rights between themselves and Ch9. The future of AFL and to safeguard the sport long term will be a deciding factor in the bid, although one would argue Ch7 is in a better position over Ch10 right now. However, if history is anything to go by, the AFL TV rights will be secured by whoever has the ‘deepest pockets’ – and one thing is for certain – a truck load of cash is going to be needed to make this deal happen
DIGITAL – XBUCKS & PAYSTATION – ADS IN VIDEO GAMES

Last week Microsoft and Sony both expressed their interest in allowing in-game ads on both Xbox and PlayStation respectively, as the gaming super giants have coincidentally shared their plans at the same time.
Microsoft’s goal is to generate revenue through ads such as in-game billboards, signs and screens. The ads would only be available on free-to-play games (think Halo, Apex Legends, Destiny and multiple more) which proves the adage “nothing is free in life”. Sony‘s plan has been in the works for around 18 months and also indicates ads will only be available on free-to-play games (Fortnite, Warzone, PUBG and a bucket load more). Sony has suggested players could watch ads to earn in-game benefits (eg. skins), the possibilities are truly endless.
This news comes just after a major development in the mobile gaming industry earlier in April. ‘InMobi’, a provider of content, monetisation, and marketing technologies, has signed a deal with in-game ads platform ‘Anzu’. Anzu allows advertisers to run content, still to IAB standard, projected onto 3D objects in the game, such as banners, buildings and billboards. The goal is to blend the ads into the game’s surroundings so they look to be part of the game.
This could become more a popular advertising medium given there is an estimated 3.24 billion gamers across the globe. Interestingly, Asia Pacific is the largest market for video gaming worldwide with 1.48 billion gamers while Europe comes in second place with a gaming audience of 715 million. If you would like more information visit https://www.anzu.io/
SMI UPDATE – MARCH 2022
March continued the positive run of growth in advertising spend in Australia. With a total spend of $697.4 million it was 2.8% higher than March’21. The first quarter of 2022 is now 9.4% higher than Jan-Mar’21 and 9.8% higher than Jan-Mar’20. SMI also monitors the forward bookings for April and May which are showing especially strong levels of growth and more evidence of continuing growth.
Once again, Government expenditure increased enormously (+109.7%) and is now challenging Retail as the largest category spender. The Government spend has increased close to threefold since Jan-Mar’20. Communications (+53.2%) and Financial Services (+44.6%) continued their strong growth. The Insurance sector is also increasing its advertising spend (+15.6%) while the Automotive category continued its decline (-2.8%).
Radio had a strong month with a +10% growth. The vast majority of that came from Regional Radio that grew +18.5%. The interesting trend has been that Regional advertising spend is doing much better than its Metropolitan counterparts. Regional TV, Regional Press and Regional Radio have all had positive increases for the past two months. Digital increased by +11.6% while TV declined -1.7%. News Media (Print & Digital) also declined by -12% and so to Magazines (inc. digital) by -13.9%. Cinema again had a solid month with a +65.2% increase.
FAST FACTS

- Camels have 3 stomachs
- 64% of Australians would like to lose weight (Morgan)
- Lightning strikes the earth 100 times every second
- There are more galaxies in the universe than grains of sand on earth
- On average, each person takes around 20,000 breathes per day
- 50,000 calls a day are made on Aust. Payphones – fyi, they are now free
At the Easter Show, 34,204 scones were baked by the CWA
Trust Us, We're In Politics Not Advertising - April 2022
TRUST US, WE’RE IN ADVERTISING POLITICS!
![]()
Given the date for our next Federal election must be called this week, we thought it timely to look at Roy Morgan’s 5th year of measuring Trust and Distrust in Australia. Morgan says the election won’t be won on trust but will be lost on distrust as people will no longer believe the government. Morgan has a net Trust or Distrust score compiled by subtracting the level of distrust from the trust. So, if someone is trusted by 30% of people but distrusted by 50%, they would have a -20 Net Distrust score. Morgan’s poll, before the budget, shows Australians’ voting intentions are split 42% for the LNP and 58% for Labor. The gap has now shrunk somewhat since the budget.
The further bad news for the Liberal party is despite a war and global pandemic, which would normally see a swing to the existing government, the electorate deeply distrusts the government. The good economic news does not seem to be saving the government. Unemployment is at its lowest since 2008, the share market has hit a record high, interest rates are at a record low, GDP is growing, Retail sales are booming and Australian’s savings are at unusually high levels. In spite of all this, consumer confidence is at a low level of 91.2 which is 17 points down since the beginning of the year.
In early March, Morgan conducted research to determine who our most trusted and distrusted politicians are. The highest Net Trust scores were dominated by Labor politicians and females. Penny Wong came in at No.1 (prior to the mean girls episode), Anthony Albanese was No.2 and Tanya Plibersek No.3. Gladys Berejiklian came it at 6th despite not being in parliament and very few people seem to distrust Jacqui Lambie.
The highest Net Distrust scores were dominated by coalition men. Clive Palmer scored the highest in Distrust but he is not in parliament – perhaps something else money can’t buy? For those in parliament, Scott Morrison had the highest Net Distrust, Peter Dutton was No.2 and Barnaby Joyce No. 3. Over the last two years, Josh Frydenburg is the big improver having dropped from No.4 to No.9 least trusted. Perhaps he is the Steven Bradbury of the Liberals. Interestingly, on Trust alone, Morrison has the highest in the Liberals with Frydenburg second. It is the distrust that lets Morrison down as it is huge for Morrison (and Dutton) meaning they score highly on Net distrust.
Morgan also measures Trust and Distrust on Industry Sectors and Brands. Supermarkets are Australians most trusted sector with Banking dropping down 14 places to become the 2nd most distrusted sector in the economy. Insurance fell 13 places from 4th to 17th while the Media sector was down seven rankings from 16th to 23rd. People lost trust in the ABC, but it is still the most trusted media brand.
In terms of Brands, the most trusted brand in Australia is Woolworths followed by Coles, Bunnings and Aldi. The most distrusted brands are Facebook at No.1, Telstra (2), Amazon (3) and Google (4). The big fall from grace came from Harvey Norman and Uber who were amongst the most trusted brands in 2019 and are now both in the top 20 most distrusted brands.
Trust is the foundation of all human connections, from intimate relationships to everyday business transactions. It is particularly important in business as we buy off people we trust, like and respect and we give those people the last chance to lose the business. To quote a great philosopher, Billy Joel, “It’s a matter of Trust”!
WHAT’S NEW IN MEDIA – ADVERTISING COMING TO SVOD!
![]()
Last month we wrote about the slowdown in SVOD audience growth and said a maturing consumer demand suggests an audience plateau sometime in 2022. Who would have thought Disney was reading our article? Since our last Pulse, Disney announced it will be launching a Disney+ ad supported platform due to come to Australia in 2023. Disney have already seen success with paid ad-supported platforms, with its US based service Hulu. 60% of its paying customers are subscribed to the system through ad supported memberships. Echoing this sentiment, NBC’s streaming platform Peacock reported that only 4% of its entire subscription base are on the full price plan with the rest opting for at least some level of advertisements.
This is good news for us in the advertising business as it is evident that consumers are prepared to accept ads in exchange for a reduced cost or free video on demand service. The trend in the US will probably be mirrored in Australia very soon, as consumers look to cut costs amidst astronomical fuel and grocery prices. Households in Australia subscribe to an average of 4.3 entertainment services and streaming services may soon find that without a lower price point offering, they may see subscriber numbers begin to dip for the first time.
Australia’s No.1 SVOD service, Netflix, has naturally relied on audience growth and subscription price increases to keep shareholders happy. This can be a difficult task based on Netflix’s volatile share price which is around 50% down from Nov’21. It is reasonable to assume Netflix is under a little pressure having borrowed $16 billion over 10 years and now seeing larger companies like the Walt Disney Company (Disney+), Apple and AT&T (HBO Max) making big inroads in streaming. The announcement from Disney seems to signal a changing of strategy from Netflix whose CEO commented on the Disney move by saying “Never say never”, a strong departure from Netflix’s steadfast No Ad policy.
Whilst BVOD has become flavour of the day, it may not be long before we are talking a lot more about AVOD (advertising video on demand).
DIGITAL – GA4, TIME TO CHANGE YOUR GOOGLE ANALYTICS
That’s right. Google are moving to a new version of analytics, “Google Analytics 4”. Perhaps the imminent death of ‘cookies’ and the issues around privacy have driven the arrival of GA4. Google describes the new version as the next generation solution to “privacy-first” tracking and artificial intelligence (AI) based predictive data all in one app. Essentially, the AI should fill out the gaps in data for website traffic and user behaviour without relying on the traditional method, using “cookies”.
GA4 allows marketers to understand their consumer to greater depth. The ability to extrapolate existing data and make assumptions about website traffic/user behaviour takes digital marketing capabilities to the next level. It’s clear that it can be difficult to understand a consumer's patterns and actions. Luckily for all, GA4 allows for a more complete understanding of the customer journey across multiple devices. The new tool lets marketers easily edit, fine tune and correct the way events are tracked, without having to incorporate coding to alter the script (like the previous version).
Should you get onboard with the new GA4? Absolutely, as soon as possible! After June 2023 your existing GA won’t work and you will only be able to analyse any old data for 6 months before it is gone. Ideally you should back up as much existing GA data as you can. To compare year on year data it is crucial GA4 is in place and running smoothly by June 2022.
SMI UPDATE – FEBRUARY 2022

February was going to be a difficult month when compared to last year as the 2021 Australian Open was in Feb’21 but moved back to January this year.
However, the February spend of $595 million was still 3.3% up on Feb’21. We have now had more than 12 months of continuous growth and the YTD is 22% up on the previous year YTD. Jan-Feb’22 is even 9.4% up on the pre-covid Jan-Feb’20 period.
Well, here’s a surprise, Government spend was once again the stellar performer in February, spending $42.4 million which is a 73.7% increase on Feb’21. Travel continues to recover strongly and increased 40.1%, while ‘Communications’ (+37.1%), Financial Services (+30.5%) and Insurance (+17.5%) also had strong increases. Automotive continued to reduce their spend and was -3.3% down for the month. Perhaps understandable if you’ve tried to buy a car lately.
Television expenditure was down -7.1% due to the metro markets as Regional TV spend was up +2.5%. Digital was up +17.8% with strong support from the Automotive category and a +19.2% increase in ‘Display’ activity. Radio had a modest +0.1% increase and again this was due to Regional Radio which was up +5.1% while Metro Radio spend was down -1.7%. ‘Digital’ Radio also increased +39.8%. Outdoor increased by +7.5% with QMS having the strongest Feb growth at +24.2%. News Media spend (Printed & Digital papers) grew by +1.2% and Magazines (Print & Digital) declined by -9.4%. As expected, Cinema had another strong increase of +107.2% compared to Feb21.
FAST FACTS

- Princess Anne last attended the Sydney Royal Easter Show in 1988
- The Anzacs were all volunteers
- Oh to be a snail – they can sleep for 3 years
- The Mona Lisa has no eyebrows
- The ABS Retail sales figures for February 2022 are up +9.07%
- Only 28.2% of Australians agree “its important to look fashionable” (Morgan)
- You lose up to 30 percent of your taste buds during flight
- In Germany, it is illegal to dance on Good Friday
- Book your holiday quick - over 4 mill Aussies are planning a trip away this Easter

Reality Dating Shows - March 2022
REALITY DATING SHOWS - Making A Fictional Series

Many of you may not be watching Married At First Sight (MAFS), however apparently lots of you are. What other reason would there be for Channel Nine to introduce another dating show? During the airing of MAFS, the audience is blessed with a glimpse of something new in the works – a casting call for a new show “Modern Dating”. This got us thinking, how many dating reality shows are out there? For Channel Nine we have Beauty and the Geek, Dating Naked (we’re not kidding – it’s on 9Now), MAFS, Talking Married, Love Island, and Naked Attraction. Meanwhile, Channel 7 had First Dates and Farmer Wants a Wife. Surely that’s plenty of dating shows right? Wrong! Channel 10 joins the party with The Bachelor and The Bachelorette and now has First Dates on 10 Play.
With so many reality dating shows now on Television, how are we to know how much of the content is scripted, and how much of it is actually reality? This topic always seems to be following many reality shows but in particular, Married at First Sight.
Presently in its 7th year on Australian Television, MAFS is the “social experiment” that follows the journey of 8 couples from their first meeting at the alter to the honeymoon and moving in together. As expected there is drama a plenty which naturally attracts the audience. As Australia watches how quickly a relationship can fail it reminds us how difficult it is to look away from a car crash and how we are drawn to the destruction … in this case of a relationship.
For those of you that aren’t keeping up (and for those of you that are), we have just finished Intimacy Week – a week in which we are trying to hide our shocked expressions while we internally question the classification of this prime-time show. Excuse me for being shocked to see a naked man doing a handstand while in the shower. Surely, he was not forced to do that. Although this is the same guy that refuses to kiss his bride in front of the camera crew as he claims that this is too intimate an act.
MAFS has a success rate of less than 7% with only 5 couples staying together out of the 72 that have been matched over the 9 seasons. However it has been a big success for Nine despite a slow decline in the Free To Air audience. On average, MAFS is the most watched dating show, with Farmer Wants a Wife, The Bachelor and The Bachelorette following behind. Perhaps the dating show genre is a bit like the relationships they manufacture – that is, difficult to keep going. In 2019, MAFS reached a national average audience of 1.86 million, in 2020, 1.59 million and in 2021 it dropped to 1.42 million. Currently, the 2022 season is reaching approximately 1.31 million people each night. However this is still a great success for Nine as it is usually the 5th highest rating program most nights it appears (behind the News programs) and is easily the highest rating program for people under 55. It’s important to keep in mind that Nine also benefits enormously from the BVOD audience which is huge for MAFS. It is the No.1 rating BVOD program and adds a huge 450,000+ audience to the nightly MAFS figures above.
The shows also produce major talkability on social media. Every night, many are battling it out to have their opinion be heard. Is this why these shows are remaining relevant despite many questioning the possibility of these shows being scripted? Among these opinions is speculation that many of the contestants are actors or at the very least, Instagram influencers, who are only on the show to boost their following. Regardless of this, we continue to watch anyway.
Reality dating shows, are they fiction or fact? We think the real question is does it matter? These shows provide us with entertainment, laughter, a great conversation starter, viable audience projections, and a slither of hope that love at first sight can work. What more could we want?
WHAT’S NEW IN MEDIA – IS SVOD LEVELLING OUT?
The advance Morgan Research figures tell us that, overall, the big five Australian streaming services (SVOD), Netflix / Binge / Stan / Disney and Amazon, have significantly slowed their viewing growth in terms of Unique Viewers (not the amount or frequency of viewing). The growth has slowed to close to half from +24.28% a year ago to 13.52% to December 2021. This suggests a maturing in consumer demand and suggests a plateau sometime this 2022 year, especially as both these two years were largely Covid years. WFH has been a benefit to any Media that can be consumed online but perhaps especially SVOD.
Why would we analyse this (you might ask) when Advertisers cannot buy this audience on these platforms?
Simply because viewers are just that, there are only so many minutes of video/program content the average person can consume. If SVOD is increasing, then it is logically taking viewer minutes away from FTA TV, BVOD or from other Media.
Decades ago we made a first whole of market analysis to calculate the average adult 18+ potential media consumption time in a week. This was approximately 54 hours of media content actively or passively consumed (passive, think for example most Out Of Home). This has not varied by more than an hour, with perhaps the exception of Covid years 2020 & 2021.
Therefore a plateauing of SVOD could and should be good for FTA TV and/or BVOD, as it holds the gradual creep of SVOD audience which is quite noticeable post 9pm each night.
Albeit early in the 2022 Programming season, there are signs that more post 9pm FTA TV programs are succeeding or at least rating better than previously. The other good news for 7, 9 and 10 are their BVOD audiences have grown on average around 26%. Maybe some of this growth was from the market leader, ABC iView, who went backwards in 2021.
SVOD is in an increasingly crowded and competitive sector fighting for the consumers dollars. It now has the growth of BVOD to contend with which again puts pressure on that finite media consumption time that we all have available each week.
DIGITAL – ‘ZAP’ ... SAVES YOUR TIME & INCREASES PRODUCTIVITY!
The “Big Data” fascination really got going in 2010 and since then technology has continued to advance. Many of the traditional large companies have that much data and data sources that it becomes a headache to manage. Linking all the data together can be a mammoth job.
One product to help manage that data overload is Zapier. It passes data between your digital platforms (Facebook ads, LinkedIn ads, Google Ads, etc.) and CRM automatically, which ultimately increases your workflow, time management and accuracy. A “Zap” is how Zapier initiates this passing of data. A zap consists of:
- A trigger - every time an event happens, a Zap runs automatically. For example, any time I get a new lead on Facebook.
- An action – the task you want Zapier to do for you. It can send you an email as soon as someone fills out a lead generation form on Facebook
- Zapier can connect many popular platforms and apps such as Facebook, Google, Slack, Salesforce etc.
This enables you to automate processes without having to create the integration yourself or without hiring someone to implement this integration for you. So why is this such an important tool? In a word, efficiency. This process alone can save many hours of data entry, reporting and updating important CRM platforms. The ability to bypass any human interference is important, as human error can slow down productivity and could prove costly if something (i.e. Facebook leads) is missing. It also helps sales team to act promptly and convert leads to customers quickly. Zapier frees up more time to focus on partnerships and customer relations instead of spending too much time on various online platforms. Lastly, the creation of a zap only takes a few minutes, which is a massive time-saver in the long run and once it is on, it runs until you turn it off so there is no ongoing maintenance for every Zap you create.
Zapier offers a free version but has plans starting at $28 AUD a month and more, depending on how many Zaps you need to set up. If you want further information about ‘being zapped’, please email Luke at lbrann@pearman.com.au
SMI UPDATE – JANUARY 2022
Advertising spend through Australia’s Media Agencies continues the strong growth pattern from last year. The January spend of $555.6 million is 15.4% up Jan’21 and is still +5.1% ahead of the pre-Covid January 2019 total. The Jul21-Jan22 period is 16.1% up year on year and has for the first time the surpassed $5 billion mark. This is a great start as 2021 was up 6.8% on 2019 and we’ve started 2022 with a large increase on 2021. However, it should be noted Jan22 had the Australian Open in it while in 2021 the AO was in February.
It feels like a broken record, but the Government spend has once again supported much of the growth. It accounts for 23% of the additional spend and the Government increased its year-on-year January spend by 51%, spending $51m in Jan’22. It is a safe bet that these increases will continue until April’22. Other categories to increase by +30% were Insurance, Home Furnishing/Appliances and Communications. Automotive was the disappointment for the month as its spend declined -18.2% compared to Jan’21. Healthcare was another category that reduced spend substantially spending $11million less that last January.
Television and Digital were again the star performers of the month. Television increased 18.9% and this can be expected to continue throughout February and March. Trying to buy advertising space on TV any time soon is a very difficult task. Digital increased by 18.7% with Social Media reporting the strongest growth of any Digital sector. Outdoor continued to get ‘back to normal’ Cinema had a good start to the year with an 81.1% increase although it was off a small base. January 2022 was a little disappointing for Radio (-0.1%), Newspapers (-8.6%) and Magazines (-6.5%) as they all had reduced spend. The Newspapers and Magazines SMI data now includes their digital spends within the Medium.
FAST FACTS
- The average cost of a 30sec TVC in the Super Bowl was around $8.9million AUD
- Australia has recorded 5,200+ deaths from COVID-19 since the pandemic began however, it is estimated that the nation has recorded 12,881 fewer deaths from all causes over the last two years than would normally have occurred.
- The average cost of a 30sec TVC in the Super Bowl was around $8.9million AUD
- In 2021, Australia was ranked the 12th happiest country in the world, New Zealand came in at No.9. Finland was No.1 for the fourth year in a row.
- The ABS Retail sales figures for January 2022 are up 5.84%
- Readership for Taste Magazine is up +48.4% in the last year
What Will Be The 2022 Revenue Market - February 2022
SWIRLING WINDS OF CHANGE – WHAT WILL BE THE 2022 REVENUE MARKET?

This month, Steve Allen gives his forecasts for media spend in 2022. Steve is certainly well placed to make forecasts as he has been doing it for 30+ years.
Here goes… a month or so ago, it seemed smooth sailing might be the case in 2022, for the Economy and for Media Marketing. But unfortunately … no longer.
In that small space in time all kinds of headwinds have formed.
- first we had the Omicron outbreak, and its fast spreading nature
- then the flow on supply chain disruptions
- the RAT test debacle
- the Supermarket & retail supply and shortage issues
- the outbreak of inflation
- the Consumer confidence read
- Business confidence fell sharply in December
- now an apparent major share market correction seemingly occurring
We think the poor consumer confidence read in mid January, was the result of an unusual convergence of factors, unlikely to be sustainably repeated. More than anything, we think the Consumer is just tired and frustrated with the uncertainty and restrictions Covid has placed upon us. This, we believe will continue to weigh on consumer confidence, however we also see skittishness in the coming weeks, not a sustained or increasing fall. Our read of consumer confidence is that it is presently quite reactive, therefore volatile, rather than spiralling down into a morass of negativity.
This makes forecasting for 2022 Media Markets more hazardous than ever.
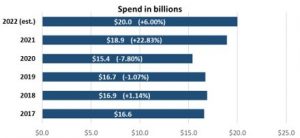
Never-the-less we developed and modelled where we believe the 2022 market will pan out at the beginning of Q4 2021. We forecast then an overall growth in Media Marketing dollars of 7.25% to total A$20.26b
Factoring in the headwinds, we now believe the market will only grow by 6.0% to total $20b. This is remarkable, a far more rapid recovery than expected in 2021 and continuing in 2022. This places 2022 all but 20% ahead of the last covid free year of 2019.
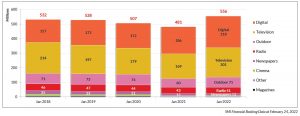
Below is the total spend (inc. all Digital and more than just media agencies) that is spent on advertising for the past 5 years.
All of this forecast 2022 growth is pretty much within Internet (other Mediums, some up some down, a mix)
Over the past few days, some commentators are taking a much more bearish view, suggesting or inferring, the wheels might fall of both the economy, and flow on to Marketing. The fear is Central Banks reaction to inflation (raising interest rates to stem inflation outbreak, and then the flow on effect to Mortgages & debt, restricting consumers spending, and ultimately the mood and confidence, leading to a downwards spiral).
We do not believe Australia is facing such a precipice. We believe the fundamentals of the Economy are sound and not likely to dramatically deteriorate. Hence our modest adjustment to our 2022 forecast, most of which is likely to be experienced in Q1 2022.
Most of the Media Agency market is measured by SMI (Standard Media Index) and this also gives us a feel for forward bookings. Media pacing (as it is called), shows a very similar pattern to non-Covid years, plus many Marketers are planning around the expected Australian Government election, forecast for May. Thus whilst we are cautious, we are cautiously optimistic!
Most media will grow in 2022 on 2021… some still making up lost ground; Radio, Outdoor, Cinema, & Magazines. Internet will continue to both dominate and distort as it is forecast by us to comprise over 65% of the Media Market.
Footnote: There is no truth in the rumour that the World’s Annual Psychic conference has been cancelled due to unforeseen circumstances!
WHAT’S NEW IN MEDIA – RADIO AUDIENCE MEASUREMENT

The Radio industry is changing the way they measure their audience and have launched a hybrid audience measurement called Radio 360. This will oversee a transition from paper surveys to the majority use of e-diaries and integrate live streaming data to provide more information on the size and profile of audiences listening across digital platforms.
For 70+ years, Radio audience measurement has been reliant on people filling out a manual diary where respondents (over 10yrs old) tick boxes for every 15 minutes of the day for a 7 day period, so long as they have listened for 8 of the 15 minutes. This is a fairly cumbersome way of getting ratings both from the respondents completing it and the researchers (GFK) who have to find people and then collect the results. There is an annual sample size of around 60,000 surveys.
Covid has driven the digital measurement and hastened the new hybrid measurement system – Radio 360. At the end of 2021, 50% of the surveys were e-diaries and by mid this year the majority is expected to be ‘e-diaries’. In essence there is not a lot of data difference between a paper diary and an e-diary except one uses a keyboard. There will also be an additional 2,000 people with ‘wearable meters’ (think watch). These watch-like devices will pick up listening on all devices but not if people are using headphones. The wearable meters will be a sense check and provide validation against the e-diaries which still rely on people remembering what they listened to and for how long. Down the track the wearable meters could also be used as a qualitative platform for particular research projects.
The most exciting aspect of future Radio measurement is the capture of streaming data. This will deliver far richer and deeper audience insights and is expected to be released as a sub-set of data alongside the usual 8 surveys a year. The first streaming data measurement is expected around July 2022. This will help bring Radio into the realm of how a great deal of today’s media is bought based on a cost per thousand delivery based on a particular data set.
The latest SMI data shows Digital Radio ad revenue growing by 44% and 37% over the last two years and accounting for 8% of total revenue. Clearly it is becoming more important for the Radio industry to measure all forms of digital listening for music, talk and podcasts and across all devices.
DIGITAL – PARADISE BY THE DIGITAL DASHBOARD
‘Paradise by the Dashboard Light’ may be an epic 1977 seduction song by Meatloaf however, 45 years later in 2022 there is an even a better way to get excited by Dashboards. It’s the Digital Dashboards that really can deliver paradise by shining light on your digital campaigns.
When it comes to delivering real-time and accurate digital results to a client, it is impossible to trump a well organised and well customised dashboard because let’s face it, it’s more engaging than looking at another Excel spreadsheet pivot table! A dashboard is a tool that can collect and organise data from multiple different sources such as Facebook, LinkedIn, and Google ads, and shows a campaign’s performance all in one place, making it easier to compare data from any time period, and can be accessed on most devices, such as a computers or a mobile phones.
The dashboard allows a client to make important decisions on the fly, as they can see results in real-time, and having the ability to check these results at any given time gives all parties a clear path to optimise the campaign moving forward without any extra time spent on campaign updates. The biggest positive of using a tool like this is the ability to customise and constantly update metrics, charts, or graphs to the client’s preference, making sure all KPI’s are represented and nothing is hidden. Above all, it offers transparency, which ensures the work being done is always being held accountable. There is no doubt a dashboard delivers that extra peace of mind and allows you to “sleep on it” (you may need to listen to the song).
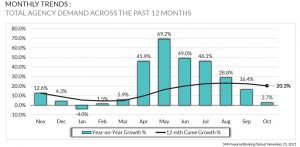
SMI UPDATE – JAN-DEC 2021
The ad market’s 2021 ad spend of $8.6 billion is +$1.6bn on 2020 and +$550m on 2019. It was expected that the 2021 year would have much greater advertising spend than the heavily impacted Covid year of 2020. It was up 23.9%, however, what is a surprise is that the 2021 spend was even up +6.8% on the 2019 figures. In the last 10 years the media agency spend (measured by SMI) has tended to increase by around 2% per annum. So 2021 has definitely been a healthy year for ad spend. The year ended with the December bookings of $710 million being 7.1% up on last year’s December.
The Government category roared up the expenditure charts to become the second largest category for 2021 with a massive 106% increase on 2020. Government spent $614 million which was still $34 million more than their combined spend of 2019 and 2020. The biggest category of Retail was only up 1.7% however it also did not have a huge fall in 2020 spend as many of the other top 10 categories had. Auto was disappointing with a 2.4% increase on 2020 as it was still -28.5% on its 2019 spend. The Insurance category was the fourth highest category with an impressive 23.4% increase on 2020 and well up on 2019 spends. The Travel category increased spend by 40.5% in 2021 but was still understandably down 35% ($155 million) on 2019.
All media had increased ad spend in 2021 compared to 2020 albeit at varying levels of increase. Television and Digital make up close to 75% of all SMI spend and they both received more than their 2019 ad spend. Digital was the star performer and was up 35.4% on 2020 while Television was up 19% on 2020. Outdoor was up 26.8%, Radio up 18.9%, Newspapers +2.5%, Magazines +4.2% and Cinema was up 61.3% although still 46% down on 2019.
FAST FACTS

- The 2022 AO Women’s final delivered a national audience peak of 4.3m making it one of the most popular sporting moments of the last 20 years
- I n FY21, immigration to Australia fell 71% to 145,800 from 506,900 arrivals in FY20
- Elvis had an identical twin brother who died at birth
- Australians spend an average of $2,776 per year via e-commerce, well above the global average of $1,435 (Hootsuite study)
- Australia has the world's longest golf course – the Nullarbor Links at 850 miles
- An Uber delivered large Cappuccino costs $8 – for those in ISO

Programmatic Outdoor - December 2021
PROGRAMMATIC OUTDOOR – OOH! MEDIA COMPLETES THE PUZZLE

Last week, oOh!media announced they had finalised an agreement with Vistar Media (a programmatic SSP/DSP tech company) allowing the platform to trade their inventory programmatically. Dipping their toes in cautiously with only Billboard and Street Furniture sites, oOh!media are the last piece of the Out-of-Home programmatic puzzle. Advertisers now have access to buying outdoor inventory across multiple formats with all major media owners through one trading platform.
For the outdoor media owners, programmatic DOOH can represent additional income (albeit small) and they hope a way to try and grab some of those Digital dollars being spent in Facebook and Google rather than taking from traditional Outdoor budgets.
Digital Out-of-Home (DOOH) can be purchased one of two ways; traditionally through direct agreements with media owners or programmatically. Programmatic trading differs in that instead of selecting individual sites, or a ‘pack’ of predetermined panels, you buy a volume of audience impressions that will be delivered across all sites at various times of day/week. The advertiser pays on a cost per thousand (CPM), opposed to a set weekly price for an ongoing space in an ad rotation.
How do they come up with the audience impressions? Currently there is no standardisation or regulation across the industry, so each outdoor media owner is using a different algorithm or formula to determine the audience or impression delivery for each screen at each time of day. They generally use MOVE data (the standard outdoor industry measurement tool) as the base, and then overlay with device ID information (e.g. seasonality trends and people movement) to calculate a figure of how many people will see your ad at the single time it is played. These figures are supplied to the trading platform to sell those impressions (this process is called the CPM multiplier).
Let’s talk programmatic pricing. The media owner sets the CPM’s the SSP can trade the inventory for. Advertisers are paying roughly a $30-40 CPM for billboard impressions and $20-30 for Street Furniture impressions. In comparison to buying direct with a media owner, a $100k national digital billboard campaign would have a CPM of approximately $15. For a week of Digital Street Furniture in Sydney you could pay $35k which would attract a CPM of roughly $6.
The advantages of buying DOOH programmatically include flexibility, location targeting and campaign timing. Campaigns can be bought on a weekly basis, paused, cancelled, moved all through a self-serve buying platform. Outdoor bought directly is largely a non-cancellable medium. If you wanted blanket coverage in a specific location, programmatic DOOH allows you to buy various formats/inventory from multiple media owners in the one transaction. The campaign can also appear at a specific time of day or weather event.
When it comes to reporting, the platform would supply a list of what screens your ads appeared on and the delivered weekly impressions. You wouldn’t receive a proof of posting photo like in a traditional buy. The verification is through the digital buying platform or DSP. However these days, most digital screen verification is now done through a reporting system such as Seedoh, which confirms that your ad “appeared”.
PDOOH is great for an advertiser who wants to be tactical and flexible with outdoor, and avoid high entry costs. Of course the traditional benefits of buying a broad Outdoor campaign remain to be high Reach and Frequency and great for branding. Programmatic DOOH currently makes up possibly 2% of all Outdoor spend in Australia and after 10 years overseas it accounts for approximately 5% of all Outdoor spend in the UK and around 8% in United States.
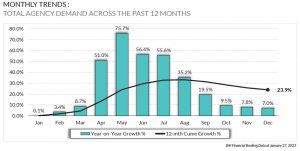
WHAT’S NEW IN MEDIA – MORGAN’S LATEST RESEARCH
![]()
The new 12 month Morgan Database (Oct’20 to Sept’21) has just arrived and without doubt has made our Head of Strategy and Research, Steve Allen, the most excited person at Pearman.
In Australian we are lucky to have, pretty much uniquely globally, such a large, stable, and continuous Single Source Database at our fingertips. This delivers not just Media metrics but also a wealth of consumer attitudes, activities, behaviour, purchasing intentions, psychographics and so on … all leading to Buyergraphics being the most accurate targeting available anywhere.
So what does this new database tell us when comparing to the previous 12 months? Remembering the 12 months prior was the epicentre of Covid -19 (6-9 months of major disruption and lockdowns). This database is similarly affected, but perhaps not as severely, excepting Victoria and to a lesser extent NSW and Queensland. Clearly, consumer behaviour is by no means back to normal.
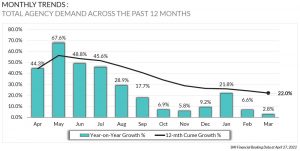
However, the summary of Media trends/movements over the last 12 months is as follows;
| Commercial FTA | +1.02% |
| BVOD | +15.24% |
| SVOD | +3.14% |
| Commercial Radio | +4.89% |
| Newspapers Printed | +4.13% |
| Newspapers Online | +2.64% |
| Magazines Printed | -3.30% |
| Internet | -0.41% |
| Social | +11.31% |
| Outdoor | -16.06% |
| Cinema | -15.17% |
There are lots of moving parts in the above, like the fact that Cinema is only now really re-opening in Sydney & Melbourne and therefore only commencing recovery. Also, many Mastheads have been cancelled and no longer exist in both Newspapers and Magazines. In lockdown, people could not move around much for Outdoor. As with all research, we use past data for future projections so it is important to appreciate and understand the nuances of research during the Covid years.
DIGITAL – WHAT’S THE META WITH FACEBOOK?
With a reported $32 billion operating profit in 2020, perhaps nothing is the matter with Facebook. However, worldwide there has been a steady stream of negative stories culminating recently in a whistleblower from Facebook saying there needs to be regulation to rein in the company’s management and reduce the harm being done to society. Facebook is Australia’s No.1 least trusted brand based on Roy Morgan’s latest quarterly Trust / Distrust survey. Australia is probably not Facebook’s most popular country particulalry given the Government passed a world first law making Facebook and Google pay for news content on their platforms. Now Scott Morrison recently announced he wants Facebook to be liable for anonymous comments. Of course this doesn’t stop Scomo from having 800,000 followers on his Facebook account.
On the 28th October Facebook rebranded itself as Meta and became the company that owns Facebook, Instagram and WhatsApp. Cynics may say it is trying to distance itself from the Facebook name. The name comes from ‘Metaverse’ meaning a virtual-reality space in which users can interact with a computer-generated environment and other users. in announcing the rebranding Mark Zuckerberg wrote, “In this future, you will be able to teleport instantly as a hologram to be at the office without a commute, at a concert with friends, or in your parents’ living room to catch up.” Meta does not want to be known solely as a social media company and sees a future in virtual reality.
Although Facebooks iteration of the Metaverse is in its infancy the concept of a Metaverse is not new. Online worlds such as Roblox and Decentraland have been established in early 2006. However, recently brands have started to integrate themselves within these online spaces.
Most notably Nike created “Nikeland” on digital platform Roblox. Inspired by the real-life Nike headquarters, Nikeland hosts a series of games and inspires users to play and engage online. As this space advances opportunities to monetize will increase with prizes won within the games potentially being transferred into real life credit to be put towards Nike products. The possibilities in this space are only just emerging.
The success of the Metaverse solely depends on if the masses adopt the technology, it’s safe to say social media is thoroughly ingrained in our daily life. But with the polarizing nature of a company like Facebook and concerns about their current influence now seeping into the conversation people may be reluctant to take part.
The Metaverse concept at this current stage is too abstract to comprehend which will lead to initial hesitancy. It will be a while before we see metaverse advertising on media plans but it’s a progressing space and a good idea to stay across new developments.
But who knows, in a few years you may be reading the Pearman Pulse while sitting on a beach in the metaverse.
SMI UPDATE – OCTOBER 2021
The October SMI spend of $753.7million is up 2.7% compared to Oct’20 however the more interesting news is that it is 1.6% above the pre-covid world of Oct’19. Whilst the September SMI data showed reduced momentum, it is great to see October has rebounded quite strongly. The Jul’21-Oct’21 is 20.7% up (vs ’20) and 3.5% up on 2019.
Government spend showed the biggest increase as it was 65% greater than in Oct’20. In fact, Government spend for Jul-Oct’21 is 162% greater than their Jul-Oct’19 spend – probably coincidental that elections are on the horizon?? The two biggest categories of Automotive and Retail are still down or static compared to last year’s spend. If they increase that will really help overall spend. Financial Services (+31.9%) and Communications (+29.6%) continue to increase their spends compared to 2020 and 2019.
As you would expect all the media do well when advertising spend is healthy. At present many of the media are booked out short term hence the importance to plan your advertising campaigns in advance. Television and Digital continue to increase their spend compared to 2019. In October Television went down -8.4% however this can be explained due to the AFL and NRL finals being moved into October in 2020. Digital had an 18.3% increase in October. Outdoor increased 12.7% but is still a long way off their 2019 level. Cinema had another good month increasing 53.4% and radio was up +6.5%. The SMI figures possibly mask what is going on in Newspapers and Magazines when you consider how many print publications have been closed over the past couple of years and the shift to Digital editions in those media. Newspapers were down -14.6% in Oct’21 while Magazines were up +15.8%
FAST FACTS

- Morgan forecast $5.4 billion would have been spent by Australians over the 4 days of Black Friday & Cyber Monday
- One million earths can fit into the sun – how small do you feel now?
- Don’t buy property in Alaska – each year it has about 5,000 earthquakes
- All Covid strains are named after letters from the Greek alphabet – hopefully we won’t get to know the whole alphabet!
- Oh to be a Turritopsis dohrnii (immortal jellyfish) – it never dies
- Tomorrow (4th December) is national cookie day so get ready to refill your cookie jar
- The price of a 40ft shipping container is 196% higher than the same time last year

TV Upfronts - November 2021
TV UPFRONTS

The month of October has been “Television Upfront” season. Each Network shows their content along with their bells & whistles for 2022. Traditionally these have been elaborate and over-the-top presentations on the media schmoozing calendar where the Networks spend well north of $250,000 on one event to show media buyers and clients that the next year will be a success. Given they have had to present the Upfronts via zoom in 2021, and therefore save a fortune, perhaps future events won’t be as big and expensive.
So why are the Upfronts necessary? They grew out of America in the 1960s when an enormous percentage of client’s Television money was committed “upfront” for the year. In Australia today, the percentage of committed funds upfront are not quite what they used to be and the deals are now far more flexible. A big part of the Upfronts is a PR exercise for each Network to give advertisers confidence in the year ahead.
In the past few weeks, Seven / Nine / Ten & Foxtel have each presented their pitch and outlined how they will attract (hopefully) larger audiences in 2022. SBS are delaying their Upfront to have a live event. These days the presentations cover considerably more and more than just free to air (FTA) telecasting, tech stacks and vendor partnerships are the call of today, mostly for the big end of town. However, refined targeting is also the battle ground, especially with both Smart TV and BVOD (i.e. addressable audiences).
After a solid and modestly increased audience in 2020, which was against recent trends, FTA TV has had a pretty torrid time in 2021 as people continued their uptake of SVOD, and BVOD offerings. Total FTA Peak Night 16-54 Audiences (those where most Advertisers demographics lie within) YTD are down by 9.7%. Now to their presented offerings.
Seven seems to be in the best position as they are coming off a year where their 16-54 YTD 2021 Peak audience is up 3%+. Our take is that they have a solid strategy overall, after a catch-up year of hits and misses. They have more the greatest depth of programming (local and overseas and we think Seven will close the Peak Average Audience gap on Nine in 2022. A combination of Seven adding audience, and Nine slipping.
Nine’s 16-54 YTD 2021 Peak Audience is down 5%+. Our take on Nines offering is that it is largely a ‘steady as she goes’ strategy. They do have a solid slate and no big series failures in 2021 however it seems a little short of programming. Nine might hold audience, although it probably depends on Seven’s success or otherwise.
Unfortunately, Network Ten did not put up much new programming despite their 16-54 YTD 2021 Peak Audience being down 21+%. Although Ten have not performed well in ratings in 2021 they have done very well in gaining additional advertising revenue. They are presently up around 29% compared to 2020 and even 20% ahead of their 2019 revenue. With TEN’s presented offerings we cannot see any significant uplift in audience.
Foxtel has so much content it makes it difficult to concentrate on any particular programming. Their upfront was very much about their streaming capability and made the point that in 2016 only 8% of their subscribers came from streaming whereas today 50%+ come from streaming. They made the point that Foxtel Go & Now, Kayo, Binge and Flash (a new News channel) are driving their growth.
We now have to wait a year to see if the TV Upfronts will once again take the number one position in the media socialising calendar.
WHAT’S NEW IN MEDIA – NEW MEDIA MEASUREMENTS

In the early days of advertising (think 1950s), advertisers gave their money to the media with very little measurement of the audience. Then came the various audience measurement companies such as AGB McNair and Roy Morgan. This gave media buyers the ability to measure their advertising campaigns by the number of people they reached and how often they reached them. Once computers started gathering pace, the amount of data collected grew astronomically. Data (in all its forms) became a big thing to measure audiences with especially from the early 2000s. As customers went online, advertisers could use cookies to gather a wealth of additional data to overlay with the traditional audience measurements.
There is now talk around measuring audiences based on Neuro insights to tap into human motivation and desire to maximise the bought media. New research metrics around attention and engagement are challenging previous media measurement currencies. In the last few weeks we have seen both ARN and Foxtel introduce potential new ways of measuring their audience.
The ARN Audio Connections Planner is designed to bring together data on audience metrics, category involvement and mental availability. ARN suggest it gives advertisers the best possible chance to connect with consumers at their most receptive moments of the day. The ARN Audio Connections Planner evaluates activity across three key data segments to better understand the ‘how’, ‘when’ and ‘what’ of consumer audio engagement. Apparently ARN have an in-house Neuro Lab to crunch the data to understand what listeners will respond best to at the moments that matter most.
At Foxtel’s Upfronts last week they launched ‘Foxtest’ as an experimentation platform which they say will help advertisers explore the future frontiers of advertising (a big statement). FoxTest will conduct a variety of tests and experiments which could include topics such as the impact of context, the power of engagement, levels of attention, new ad formats, servicing models or the revelation of standard metrics.
Naturally the holy grail in media buying is for the campaign to be the most effective in achieving the goals required. If new ways of measuring an audience can help achieve that then it will be an invaluable step for media planning.
DIGITAL – GOOGLE ANALYTICS (GA)

Have you ever opened Google Analytics and wondered where to look and what it all means to your business. Hopefully the following will make it a little easier to appreciate the value of GA.
The data collected by Google Analytics can be used to optimise your website and increase overall traffic and viewers to paying customer conversions. Google Analytics is an indispensable tool for understanding and adapting your business to your consumer preferences and behaviours, so let’s dive in and learn how to make the best use of Google Analytics.
As a user of Google Analytics, it is important to be aware that it not only tracks the number of views, it also supplies demographic data and information on the people who visit your site daily. It will show which page they spend most amount of time on and why you may not be converting and much more. The Google ‘segments’ feature is something you should ensure you make full use of. This feature will allow you to view a wide array of demographic data about your visitors including their age, gender and location. It also gives key information about Bounce rates and helps to find out any problems associated with conversions.
In addition to segments, it is important to understand how to use the ‘goals’ feature inside of Google Analytics. This feature is crucial to facilitate your business progress and should not be overlooked. An example of a goal can be as simple as “make a sale” or “place an order”. You can create what is called a funnel and track a user’s progress toward a specified goal. From the goal setting process you also identify any issues or bottlenecks encountered by the user. This feature is like a revelation in that it allows you to identify any user interface viewers have when using your website and particularly those which the consequence ends up losing you revenue. In this way, Google Analytics can help not only improve the quality of your website but also facilitate the money-making potential of your business.
Another powerful and fascinating feature of Google Analytics are access to what are known as conversion paths. Every user who visits your site is different, and understanding their behaviour is crucial to making your website a success. The conversion paths feature allows you to see which pages your users click on and in what order before they make a purchase from your site. This data can be used to better optimise your website and more efficiently direct users to the buy button.
These tips should give you a better understanding of how best to make use of Google Analytics. In the right hands, Google Analytics should help you to not only improve the quality of your website but also grow your business and revenue.
SMI UPDATE – SEPTEMBER 2021

The September SMI spend of $700.2 million is up 15.5% compared to Sep’20. Due to 2020 being such an anomaly, it is prudent to compare the months against 2019. Since May this year each monthly spend has either been in line with or greater than 2019. However, Sep’21 was down 9.2% compared to Sep’19 and was also the biggest fall since Jan’21 which was down 13.3%. Therefore, the September result is showing reduced momentum particularly considering the AFL and NRL finals series were back in September after being moved to October last year. The Jan-Sep YTD is still up 27% (vs ’20) and slightly higher than 2019.
Over the past 5 months Government spend has increased an average of 60%+ but in September that dropped to a 14.4% increase. The football finals meant that Gambling had a large category increase with 53.2% while Communications was up 66.1%. Automotive advertising put the break on a little and was down 6.6%. Given the issues in trying to buy a car at present perhaps this shouldn’t be a surprise. As retail is such a large category ($76mil) it was good to see that increased by 10.5%.
Television (+17.1%) and Digital (+20.1%) were the best performing media. TV had another good month of $310 million while $259 million was spent on Digital. Remembering there is a huge amount more spent on Digital outside of the media agencies represented in the SMI panel. Radio is looking healthier and its $50 million represented a 12.8% increase on 2020. Magazines had a strong lift and were up 19.6% while Newspapers were down slightly compared to last year. Outdoor only had a 3.8% lift and was still down 56% compared to Sep’19. There is hope for Cinemas as they increased 231% (off a small base) and with lockdowns lifting things must be getting back on track for them. Especially given the run towards Christmas and the new James Bond movie in November.
FAST FACTS
- Mozambique gives you the highest score in scrabble of any country in the world
- The Sydney to Perth Indian Pacific train line has the longest straight line of railway (478 km) in the world
- Approximately 1.8 million Australians smoke, this is down 20% from FY17
- The feeling of getting lost inside a mall is known as the Gruen transfer
- Greenland Sharks can live for 250 – 500 years
- We breathe through one nostril at a time and switch to the other nostril every few hours
- World Kindness Day is Saturday 13th November - be kind to each other, yourself, and the world.

How We Have Changed Since COVID - October 2021
HOW WE’VE CHANGED SINCE COVID

Morgan’s latest 12 month research data for Jul20-Jun20 has recently been released and we thought it would be interesting to compare that to the pre-Covid period (Apr19-Mar20). There are a multitude of interesting consumer insights showing how we have changed since Covid became part of our lives.
Firstly, the burden of lockdown does not seem to have driven us to drink. Our alcohol drinking ‘in the last 4 weeks’ has only risen by 2.7%. The Ready To Drink alcohol sector has been the big mover with an 18.2% increase. One somewhat logical trend down was Champagne is down 31.5%. Possibly people don’t think we have had much to celebrate or have not had social gatherings where you would expect Champagne to be at the top.
It looks like we may be coming a little more generous and perhaps a little bit larger. The number of people who believe a percentage of everyone’s income should go to charity has increased by 6.2% (or 325,000 people). The number of people who respond to charities with their heart as opposed to their head has also increased by 5.3% (493,000 people). In terms of the waistline, there are now another 601,000 people (+4.6%) who say they would like to lose some weight.
It is not surprising whilst at home we have been hammering the internet shopping which is up 30-40% compared to pre-Covid. The biggest category increases for internet shopping have been Fashion (+91.6%), Electronics (+87.2%), Health & Beauty (+77.1%), Pets (+64.6%) and Food & Beverage (+58.7%).
Despite many of us being locked down, the intention to Travel in the next 12 months has seen a large drop. The border closures have created a great deal of hesitancy although presumably once marketing spend returns to the Travel sector this intention should change.
Extraordinarily, given the pandemic we’ve endured for the past 18 months, consumerism is on the up and up with households bringing in higher incomes. Households with income over $300,000 have increased by 20% while households with income below $35,000 p.a. have fallen by -17.1%. That probably explains the increase in products that Australians intend buying. In the next year, the intention to buy a new house is up 14.3% although record low interest rates would surely have a lot to do with that. The intention to buy a new car is up 49.2% and a 4k TV is up 171%.
The WFH phenomenon seems to be continuing as the necessities of running a business from home are still in high demand. The number of people who intend to buy WFH products in the next 12 months has increased substantially. Intention to buy a Wireless Home Router is up 149%, a Scanner (+131%), a Printer (+92%), Desktop computers are up 19% and Laptops are up 17%.
Although it is counter intuitive, it seems that we have more cash and are looking to spend it. Perhaps that’s why advertising spend is also looking very strong – see the following SMI data. One positive from being locked down with the family is that people who agree with the statement, “I am very proud of my family”, has increased by 67.1%. Good to know that every cloud has a silver lining!
WHAT’S NEW IN MEDIA – VOZ HAS LANDED!
![]()
Virtual Australia (VOZ) is Australia’s first truly national picture of total TV viewing on all screens and was launched on the 4th July 2021, for eligible advertising agencies to use. It was a soft launch without the fanfare usually associated with the 4th July. Possibly because the launch date had been pushed back a few times due to issues raised along the way in what is a complex research project to complete.
Watching TV content via the internet on connected TVs, Laptops, PCs, iPads and iPhones is growing and it is important to measure that audience. VOZ will be particularly beneficial to clients and media who need a total audience measurement or to measure a specific Reach & Frequency goal. For instance, if you were one of the thousand in program sponsors on The Block (think Domain, Kennards, McDonalds, etc) you can now determine the combined reach that the sponsorship is delivering. Or if you are a client buying TV based on specific Reach & Frequency goals (e.g. 50% Reach, 3 times) then VOZ will be able to deliver the combined R&F across all the screens your campaign is appearing on e.g. Linear TV, Catch Up TV (BVOD) or Foxtel (SVOD).
Interestingly, in many agencies BVOD is bought via the Digital team and they use the Nielsen figure which is effectively the one email address attached to the connected device. Therefore, those figures can often under-represent the audience as it does not allow for co-viewing. VOZ allows for the co-viewing through modelling a multitude of different data sources and estimating the total BVOD audience. VOZ is a terrific start although there is still work to be done particularly around the measurement of BVOD advertising campaigns.
The initial trends out of the first rounds of VOZ reporting see the traditional pillars of commercial TV, such as News and Sport, are still being viewed predominantly in front of the television with around about 2-3% of viewers opting to view via BVOD. However, the ‘tent-pole’ shows for the Networks are seeing a sizeable amount of their audience opting to watch via connected devices, with The Voice and The Block recording 12% and 14% as the BVOD audience respectively.
It will be interesting to see if VOZ has a financially positive effect on the Television industry. The Outdoor media had a boost when ‘Move’ was launched to better measure the total audience. Naturally the Digital site conversions were a massive help in gaining more revenue for Outdoor however the new Move measurement system also contributed quite a bit.
More info about VOZ can be found at https://virtualoz.com.au/
DIGITAL – SEO FOR BEGINNERS

With an estimated 63,000 searches a second happening around the world, Search Engines provide advertisers with a plethora of consumers that are actively ‘in-market’ for their products. With a search volume that large, it is no surprise that Search advertising made up around 50% of the total digital advertising expenditure here in Australia for FY21, but what if there was a way to get traffic to your site for ‘free’?
The answer is SEO. Search Engine Optimization or SEO involves continually ‘improving’ or optimising your website to increase traffic and ranking on ‘organic’ or non-paid search engine results. It provides a fantastic way for companies to drive increased traffic to their site at a reduced cost, with a recent report from Nielsen indicating that a whopping 94% of total search engine clicks go to organic results, and only 6% going to paid search ads.
The trick is to ensure you are continually optimising your site so that search engines will recommend your website or content in response to a consumers search query. The search engine ecosystem is dominated by Google, who have around a 92% market share as of June this year. Google’s system uses ranking factors to sort through billions of webpages in its search index, which is a database of all websites it has indexed (a process used by Google to understand what a page is about), to then find the most relevant results in a matter of seconds. Your site will be ranked through multiple on & off page factors, such as site and page speed, content or keyword targeting.
After ranking, websites will then appear on search engine result pages (SERPS). SERPS are Google’s response to a user’s search query and include organic and paid search results, with paid ads sitting at the top and organic results below. Optimizing your website will help supply better data to search engines so that you’re content will rank as high as possible throughout SERPs.
A tool that Pearman uses for SEO is called ‘Ahrefs’ which does a site audit, analyzes competitors, sees what your customers are searching, ensures content is relevant and tracks your ranking. This allows companies to constantly increase their share of voice and chance of acquisition across the search engine landscape.
SMI UPDATE – AUGUST 2021

The August SMI figures continue to show advertising spend doing very well when compared to 2019 and even 2018 corresponding figures. The August spend was $691.6 million which is 11.6% up on 2019 and 4.1% up on August 2018. Although half the Olympics were included in August, this is still a very promising result. The Jan-Aug21 advertising spend is up $62 million on the same period in 2019 and pretty much in line with 2018. SMI is also saying their forward bookings for September and October are looking encouraging, so it seems safe to say 2021 is going to be a good year for advertising expenditure and not just compared to 2020.
In terms of which categories are spending, Government has been the star performer and has now spent 4 times more in Jul-Aug21 ($88mil) compared to Jul-Aug19 ($21mil). Categories in the Top 10 spenders such as Food, Restaurants, Insurance, Financial Services and Communications continue to increase their advertising spend. The top 10 category total spend is up 17% in Jul-Aug21 vs Jul-Aug19. Within the top 10, Retail has the lowest increase (at 7%) however it also accounts for 10% of the total market. If Retail can bounce back like the other categories, it will certainly be a great boost to expenditure.
Television had a huge August (assisted by the Olympics) and exceeded $300 million for the month. The best August result since the Rio Olympics in 2016. Digital, Outdoor, Radio, Cinema and Magazines all had 20%+ advertising spend increases compared to August 2020. Although Newspapers had -9.6% for their print ad revenue, there is generally a very healthy growth in the advertising revenue Newspapers are receiving through their Digital editions.
FAST FACTS

- Melbourne Storm have the most NRL supporters with 1,211,000. The Sydney Swans top the AFL supporters with 1,031,000 (Morgan 2021)
- Alfred Hitchcock suffered from ovophobia, he had a fear of eggs
- One quarter of all your bones are in your feet
- Something sent by car is called a shipment but when it is sent by a ship it is called cargo????
- The bird in Twitter’s logo is called Larry
- The High Court recently ruled that the owners of Facebook pages are liable for defamatory comments made on them.
- Small Business employs two out of three working Australians
- We’ve just missed World Smile Day (1st October) but don’t let it stop you giving a big smile to your friends & family today.
- Don’t forget, Halloween is the last day of this month – 31st October

When Too Much Sport Is Barely Enough! - September 2021
WHEN TOO MUCH SPORT IS BARELY ENOUGH!

Warning, blatantly obvious statement to follow: Australians love their sport! So much so that Australia arguably has the world’s strictest anti-siphoning laws ensuring you will be able to watch a large variety of sporting events on free to air TV Channels. The NRL, State Of Origin, AFL, Melbourne Cup, Australian Open, Cricket and Motorsport are just some of the sports covered under the anti-siphoning laws. These Sports are also extremely important to the Networks as News and Sport seem to be the last bastion of guaranteed high ratings for the networks.
Going back many years, Australians only ever had the 3 free to air stations, SBS and the ABC to view Sport on. Fox Sports came along in 1995 and it took close to another 20 years before BeIN sports offered a reasonable alternative in 2014. Optus Sport came to the market in Jul 2016, Kayo in Nov 2018, Stan Sport in Feb 2021 and Paramount+ Sport in Aug 2021. We now have more sport coming to us than we can possibly watch.
Interestingly, for those that watch sport on Television, the older age groups (50+) index very highly for the sports covered by the anti-siphoning laws. While Sports outside these laws such as Football and NBA (American Basketball) are very popular with the younger 14-24 age group.
While the Government is protecting the older sport loving population (& the Networks) from missing out on seeing major sports for free, the Telecommunication companies and Streaming platforms are fighting it out for all other sports which tend to appeal to younger sports lovers. The sports on the Telecommunication and streaming platforms naturally come with a price. This means younger fans have to pay to see the lower profile sports but who wouldn’t want to pay to see the American Ultimate Frisbee League (presently on Kayo).
The Telecommunications companies have huge revenues and can trump all other bids for sports. If it wasn’t for the Government ‘protected’ sports we would all be paying to see our national sports, like the English pay to see the Premier League Football. In Australia, Optus was the first to pounce with Football. Optus Sport broke Foxtel’s 20 year stranglehold on the English Premier League rights with a $200 million bid for 3 seasons, reportedly $100 million more than Foxtel’s bid. Network Ten similarly wrestled away the A-League football rights from Foxtel with a 5 year $200 million deal to help launch its latest subscription video offering, Paramount+. And to further complicate the issue, Stan Sport announced they have secured the rights for the European football continental competitions, the UEFA Champions League and the Europa League. Although Football coverage is now very fragmented, there is more available than ever before. However Australian Football fans are looking down the barrel of $44 a month in order to follow the sport they love domestically and in Europe.
The reality is that for the younger (14-24) part of that audience, a large proportion are reverting to illegal streaming to view one or more of the competitions. Clearly the illegal streaming is not enough to put these Sports platforms off as we have been inundated with them in the last couple of years.
In terms of being a sports fan, it has never been a better time to be in Australia even if you have to pay for some of it. To quote those great Australians, Roy and HG, it is a time when too much sport is barely enough!
WHAT’S NEW IN MEDIA – OLYMPIAN EFFORT LIFTS THE VOICE

There has been a thought that a ‘halo’ effect occurs when TV Networks purchase major events, in particular the Summer Olympics. The halo refers to a general increase in ratings across the network after the event. Based on analysis back to the 2008 Beijing Olympics by our Head Of Research, Steve Allen, we can definitely demonstrate there is no long term halo effect with ratings. Programs like News, Sunrise and Home & Away may have an initial small increase but show no appreciable longer term growth in audience from before to after the Olympics.
However, what the Olympics does deliver (like other key high profile extended coverage events) is a unique promotional platform. Network Seven has shown this with its 16 days of Olympics, with dominant and pervasive audience numbers – there is no better promotional platform.
A Network has to have the Programs, Promotion, Publicity and Programming nous to make the ‘opportunity’ a winner. Of course, Programs above all else. Seven has done this superbly to cross promote season 10 of The Voice which has been a huge success for them. After heavily promoting The Voice throughout the Olympics, they then launched it on the last night of the Olympics between the News and the Olympics Closing ceremony. The Voice achieved 1.414 million (consolidated) metro viewers which was the biggest launch night it has had since 2016. It is so successful that The Voice audience is 20% higher than last year. Not many programs increase their audience in their 10th year! It is also reasonable to assume the success of the cross promotion has contributed to The Block launch losing 17% audience compared to 2020 as it was directly against The Voice.
DIGITAL – VIDEO CONTINUES TO GROW
Video may not have killed the Radio star but it is certainly killing it as a format in the Digital world. The Interactive Advertising Bureau’s (IAB) FY21 report on advertising expenditure shows Video growing the most of all formats at 38.8% YOY to $2.366 billion. The SMI figures back this up and also show Video has grown at 46.6% in FY21.
In terms of where Digital Video is used, the IAB says almost half was spent on connected TV (47% V 38% YOY) and that growth came from desktop which decreased from 36% to 32% and mobile from 26% to 21%.
Video now accounts for 21.4% of all Digital expenditure or 1 in 5 of every dollar spent online. As a format it can be highly effective as it has sound and movement and is easy to digest, entertaining and engaging. Although there is debate that not all video is created equal and the impact is different across BVOD, short-form video, YouTube and Facebook.
Digital Video’s inventory landscape is fairly complex with a lot of players but can be looked at by grouping the multiple publishers and platforms into three main areas of inventory; 1. Catch up TV/BVOD 2. Publisher portals/sites and 3. Social & video sharing platforms
Where possible, on social and video sharing platforms, the best way to have an impactful campaign is to build platform specific creative, as opposed to cutting down a TVC to a shorter length. For skippable ads, it’s critical to have something attention grabbing within those first 5 seconds, to give the user a reason to stick around.
In terms of the cost of using Video, it is a bit like asking how long is a piece of string. There are so many factors greatly affecting the cost which can be as low as $5 a cost per thousand (CPM) on YouTube or even as high as $65+ CPM for BVOD. The more targeted and more data you overlay, the more you pay. You can buy as a CPM (no guarantee how much of the video has been seen), a cost per click (CPC) or a ‘completed view’ (CPCV). It will also affect the cost if you buy directly with the publisher (called an Insertion Order – IO) or Programmatically through a DSP (Demand Side Platform)
The measurement and way you deem a video campaign to be successful is tied to the campaign objective. It’s very, very tempting to measure and track every possible metric, but to remain single focused, and always with the objective in mind, is key in both deciding the campaign was a success, and, making optimisations towards that metric along the way.
SMI UPDATE – JULY 2021
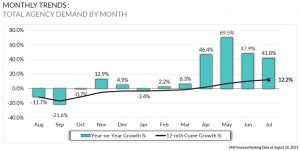
The July SMI figures continue the pattern of strong growth which is expected against 2020 but not against 2019. July was $632 million which is 41.8% up on Jul20 and 7.4% up on Jul19. Half the Olympics were in July21 although this is still a very positive way to start FY22. Interestingly, the Covid affected states of NSW and Victoria still have the greatest increases with 52% and 46.3% increases respectively. SMI is also saying the forward bookings data for August, excluding Digital, is up 15% with September also looking good at present.
All 10 of SMI’s ten largest categories had double digit growth in July. Leading the way was Government spending $44 million which was an additional $22 million on July20 and a 296% increase on July19. Insurance and Restaurants were both up 47% while Communications was up 62% spending $26 million. Retail, the largest category, had the lowest increase of the top ten at 13.7% accounting for $63.8 million spend.
Television was up 41.9% and naturally Channel 7 had the largest increase (+80.5%) due to the Olympics. Outdoor had a 111% YOY increase although it was off a small base as it was hit hard in July20. Street Furniture was the big winner in Outdoor with a 189.9% increase. Digital was up 39.6%, Magazines (+34.4%), Radio (+14.9%) and Newspapers was up 8.6%. Cinema was up a gazillion percent as they had virtually no bookings in Jul20. Unfortunately, the present lockdowns are not going to be doing Cinema any favors.
FAST FACTS
![]()
- When launched in 1885, Coca-Cola's two key ingredients were cocaine and caffeine. The cocaine was derived from the coca leaf and the caffeine from cola nut, leading to the name Coca-Cola.
- Australians are set to spend around $800 million on Father's Day presents this year, with alcohol and food topping the gifts
- The first Paralympic Games were held in 1960 in Rome
- Of the 2.3 million small businesses in Australia, the Australian Small Business and Family Enterprise Ombudsman (ASBFEO) say 1,491,973 are sole traders.
- On September 23 we celebrate the vernal equinox; one of the two times during the year when night/day are of equal length.
- Each year, cows kill more people than sharks
- One for lockdown - by replacing potato chips with grapefruit as a snack you can lose 90% of what little joy you still have left in your life.

Television Trends & Travails - August 2021
TELEVISION – TRENDS & TRAVAILS

After half a decade of waxing and waning in popularity, Television is witnessing a remarkable resurgence with both marketers and advertising revenue. Television’s advertising revenue is up 10.6% in FY21 (vs FY20) while the total ad spend is only up 7.1%. In other words TV is outstripping the total market by 49%.
On the client side, Television is benefiting from relatively new categories such as ‘Food Delivery Services’ (Doordash, Menulog, etc) and Financial clients such as WISR, Superhero & Bell Direct. The Retail category is invariably the largest category and clients like Woolworths, Harvey Norman and Bing Lee are certainly showing their faith in Television.
It was not long ago that the advertising industry and trade media were writing off Television as yesterday’s media however we presently have three strong TV Networks. Nine is now part of a hugely diversified media company, Seven has its debt under control and Ten is backed by ViacomCBS. This is evident by the Nine and Seven share price movements. If you were smart enough to buy Nine / NEC shares a year ago your money would have grown 104% ($1.35 to $2.76) and in Seven / SWM it would have grown 380% ($0.10 to $0.48).
On the audience front the Networks have been losing audience on their main channels but gaining audience on the digital stations. Like all media, the traditional Television audience has fragmented greatly (due to SVOD, BVOD etc) although in 2020 the average main channel Peak Night audience actually increased slightly, the first increase in nearly a decade. Unfortunately 2021 commenced with a major spanner in the works with the delay of the Australian Open Tennis by two weeks. This caused havoc with both Nine and Seven’s quarter one launch formats resulting in a loss of audience and also complete disruption to programming and momentum. The Australian Open has traditionally been used by Seven and Nine (since 2019) as a way to launch their first quarter programs and particularly their major new programs. The Australian Open’s audience was down double digits this year and consequently it did not provide as strong a platform to launch the year for Nine. Early in the year, the main commercial channel audience was down around 20% but recovered in recent weeks to be down circa 8%.
Programming has been a year of modest hits and quite a few misses. No Network has been immune although Seven’s Holey Moley and Ultimate Tag certainly didn’t help them. This unevenness and difficulty to predict the viewing market has further exacerbated audience deliveries. Judging recent weeks, where all three Major Commercial Networks are programming better and more competitively the ratings malaise of the first half year may be behind us.
Despite the ratings being down there has been a renewed demand for airtime meaning we need to allow far more time (12+ weeks) to ensure we’re able to buy an optimised TV campaign. Something Advertisers and Buyers have not had to contend with for 5 years. The overall YTD trend has played havoc with campaign audience delivery and whist pretty much all Networks are using an audience projected negotiation rate card, these have proven to be optimistic. Worse, the uneven spread of popular rating programs has concentrated buyers to grab the cost efficient programs at a considerably faster rate than in the recent years.
Fortunately for the ratings, we are presently in the middle of the world’s biggest sporting event and for Australia it is in the same time zone. With roughly half of Australia at home in lockdown and the Aussies winning lots of medals, this is proving to be a huge boost to Seven’s ratings. The halo effect of airing the Olympics is increasing other Seven programs (e.g. News, Sunrise) by 30-40%. Conversely, it is decreasing the other stations ratings by around 10-20%. Overall more people are now watching TV due to the Olympics and there has been a massive boost to the 7Plus (BVOD) app.
Television has not been in such a good financial position for many many years with increasing ad revenue, high demand for airtime and increasing share prices.
WHAT’S NEW IN MEDIA – LOCKDOWN SILVERLINING
Although it is hard to find too many positives from the COVID-19 pandemic, we can say that the digital components of Television and Newspapers have been given an opportunity to flourish. Both have seen a strong rise in consumers and advertising revenue which no doubt has been accelerated due to the lockdowns.
For Television, Broadcast Video on Demand or BVOD’s advertising revenue grew 39% in 2020 and continues to grow enormously with big sporting events in 2021. Channel 9’s coverage of the recent State of Origin saw 228,000 additional viewers opting to stream the 2nd game on 9Now, up 48% on 2020 and 162% on 2019. While on Seven, the Tokyo Olympics has ensured the 7Plus app has been downloaded over 8 million times. In addition to Sport, the need for News during a pandemic is another reason the apps are growing. The other good news for the Television Networks is the apps attract a younger audience that has been difficult to retain on the main channels. All this has seen the advertising revenue on BVOD growing at 50%+ per year.
For Newspapers, their digital news subscriptions grew by 23.5% in 2020 and are going from strength to strength. Last week the Olympics delivered News Corp a 35%+ increase in website traffic. In the latest April-June quarter advertising revenue for the Digital newspapers grew 44% while the printed paper revenue declined 6%. Australia lags behind the global average of digital news subscriptions which hints that the current lockdown may lead to even more growth in the sector.
The road to recovery in a post COVID Australia may be a long one but for Television and Newspapers the recovery has already begun through their digital platforms.
DIGITAL – EASILY INFLUENCED?

With around 80% of Australians having an active social media account, it’s created a gold mine for Influencers to reach a wide range of consumers.
The global influencer market has apparently grown from $2.3 billion AUD in 2016 to a projected $18.8 billion in 2021.
This growth in the influencer market has seen the establishment of platforms such as Tribe and Vamp which provide structure, measurability, and accountability for potential campaigns. Ideally, using agencies like the above give clients the confidence that influencers have been pre-vetted and are suitable for specific campaigns.
With influencers emerging as a profitable career the question often asked is “How much money do they actually make?”. The influencer landscape is split into five main categories.
| Category | Followers | |
| Mega-Influencer | 1 million+ | Hugh Jackman (30 million) Chris Hemsworth (50 million) |
| Macro-Influencer | 500k – 1 million | |
| Mid-tier Influencer | 50k-500k | |
| Micro-Influencer | 10k-50k | |
| Nono-Influencer | 1k-10k |
Micro-influencers are the most common in Australia making up 46% of the influencer landscape.
Micro-influencers make anywhere from $15-$150 per post. While Mega influencers can make from $700-$15,000 per post. If you’re one of the lucky influencers, such as Australian Tammy Hembrow who has amassed 12.7 million followers, you can earn up to $85,000 per post.
So what are you waiting for, with Influencer marketing as an emerging form of advertising perhaps you should stop reading this and concentrate on boosting your social followers.
SMI UPDATE – JUNE 2021
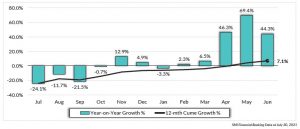
Advertising spend in June was the largest month of ad spend ever recorded in a Jan-Jun period in SMI history - $754 million in June. This is a 44.3% increase on June20 and $643,000 more than June19. FY21 is +7.1% above FY20 although this includes the heavily affected months of Apr, May & Jun’20. When comparing the 12 months of FY21 to FY19, the advertising spend is down -7%. The latest six months spend of Jan-Jun’21 looks more positive when compared to Jan-Jun’19 as it is only -2.57% down. The Jan-Jun19 included spend for a Federal Election but also had a couple of rocky months. Overall, ad spend is looking good with SMI saying the forward July & August bookings are looking strong albeit partly buoyed by the Olympics.
The two largest categories of Retail and Auto influence the spend quite a bit. In June21 both these categories were up 33% and 48% respectively. Looking at the FY21 vs FY20, Retail is up 12.7% but Auto is lagging somewhat at -8.8%. Auto is still around 30% down on what it spent in FY19. Travel has certainly been coming back in a big way with a 157% increase for Jun21 vs Jun20 and quarter vs quarter it was up 272.9%. Government is a category that has continued to spend and is up 12.6% comparing FY21 to FY19.
Outdoor continued to recover in June and was 146.9% up on Jun20 but still
-10% down on Jun19. Television did very well and increased 39.9% on Jun20 and was only -2.2% on Jun19. Radio was up 38.2, Digital (+37.9%), Magazines (+27.5%) and Newspapers (+0.8%). Cinema increased a whopping 367.9% in Jun21 although it is off a very low base in Jun20.
FAST FACTS

- Hidilyn Diaz won the Philippines first gold medal in women’s weightlifting. She also won $899,00 AUD and a mansion from the government & businessmen.
- Australia’s ABS unemployment rate fell to 4.9% in June21 – lowest in 10yrs
- 3% of Australian mortgage holders were at risk of 'mortgage stress' in mid 2021 – this is a near record low ! (Morgan)
- Motorboat sailing, hot air ballooning, and tug of war all used to be Olympic sports
- Until 1912, first-place Olympic medals were made of solid gold. Now they are covered in 6 grams of gold.