

Pearman Pulse - July 2020

GREED IS GOOD, GREED IS RIGHT, GREED WORKS!

That was Gordon Gecko’s motivation (from ‘Wall Street’) to convince shareholders that his way was going to put cold hard cash into their pockets. It could be suggested not a lot has changed since that 1987 movie with ‘share price’ being the main and most compelling measure of a company’s success. Share prices now make the nightly news and are relied upon by tens of millions of investors, especially retirees looking for dividends. Companies also rely on their share price to raise capital when issuing more shares. Perhaps the biggest driving force for a high share price is many senior management positions have stock options based on the performance of their company’s share price. Unfortunately, stock options can cause management to focus on short-term performance or to manipulate numbers to meet targets.
So where do the people who make the profit (aka the employees) rank compared to the share price? Sadly, the answer is probably not too high. Companies obviously need to ensure they are financially healthy to keep employees in jobs but how much profit is enough? It seems the system we have puts enormous pressure on CEOs, CFOs, and other corporate leaders to move heaven and earth to keep their share price high.
The “triple bottom line” (TBL) was coined in 1994 and aims to measure the financial, social, and environmental performance of a company. The three elements being profit, people and the planet. The idea is a company can be managed in a way that not only earns financial profits, but which also improves people's lives and the planet.
The TBL seems to have come in and out of vogue and only for a short period become mainstream. For independent companies, with a handful of shareholders, it is probably easier to put the TBL in place. For listed companies, the only hope are the investment firms that control enough of a company to ensure management take notice. Interestingly the world’s largest investment firm, BlackRock, seems to have done that recently. BlackRock have $10 trillion in assets under management (yes, trillion) and has put climate change at the centre of its investment strategy. They have said they will abandon companies heavily invested in thermal coal and demand that companies report their exposure to climate change risks, their contribution to emissions and their plans to reduce them. In Australia, the $52 billion HESTA super fund has also divested holdings in thermal coal companies.
It’s great to see large investment firms looking after the planet although wouldn’t it be fantastic if employees were prominent in the triple bottom line as well. Companies rarely grow on the back of unhappy employees. It’s the commitment and talent of employees that power most successful companies. Any good manager knows staff motivation is crucial in the financial health of a company. This is particularly relevant to acknowledge today given the number of retrenchments in the news of late.
Naturally companies need to be profitable although a sole focus on the P&L or balance sheet must surely breed more Gordon Geckos. What a wonderful world it would be if all companies adopted the triple bottom line so that staff and the planet are also looked after!
WHAT’S NEW IN MEDIA – CINEMA IS BACK TODAY

Around 80% of cinemas are opening today (Thu 2nd July) in time for school holidays. The initial movies will be a mix of recently released movies and classics (eg. Harry Potter) along with reduced pricing.
After July there will be many blockbuster movies crammed into 5 months from Aug-Dec’20 that were due to be released pre-covid 2020. Some of the big movies coming our way are Tenet (13th Aug), Mulan (20th Aug), Wonder Woman 1984, Bond ‘No Time to Die’, Black Widow and Top Gun Maverick.
The audiences are anticipated to be 50% of Pre-Covid averages across the Jul – Sep quarter and then returning to 85% during the Oct – Dec quarter. Interestingly NZ has been re-opening for the last 6 weeks with 95% of Cinemas open and audiences have been growing at an average of +73% week on week over this time.
DIGITAL – AMAZON, SHE’S GETTING BIGGER & STRONGER IN AUSTRALIA!

Amazon started life as a book reseller and now sells virtually anything online. While many companies are still coming to terms with the impact Covid-19 has played on their industry, the American giant continues to slowly but surely cement themselves throughout the digital advertising marketplace.
In the US, Amazon now receives around $12 billion p.a. of the digital advertising spend. They sit only behind the digital ‘duopoly’ of Google and Facebook. Their increased presence in the US market doesn’t stop there as many surveys have shown that the site is number one for product specific searches throughout the US, with up to 55% of consumers saying they still start a product search on Amazon.
Having only just started in Australia a few years ago, Amazon doesn’t quite have the same presence they do in the US, but they are slowly starting to get a foothold across the Australian retail market. Over the last 6 months the Australian site has seen around 26.5 million visits. Recently, Amazon has also announced a $500 million investment in a new Western Sydney distribution centre that will house around 11 million different products. This should go a long way to increase their delivery speeds.
With an increase in fulfilment centres and the introduction of Amazon Prime, the company is looking to drive more consumers to the site and become the ‘one stop shop’ for online retail products. Something that is not currently seen in the Australian retail market. As Amazon’s market share increases throughout the Australian digital landscape more opportunities for advertisers will follow from a bigger database of consumer habits.
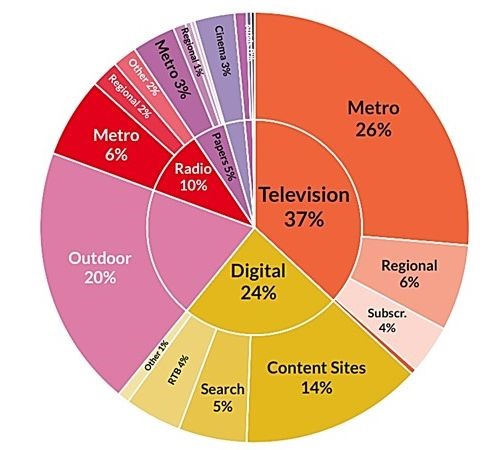
SMI UPDATE – MAY 2020
The latest SMI figures show May’20 is down 40% compared to May’19 as the full impact of Covid is being felt. The early June figures also show a 40%+ decline in spend putting the industry on track to a record quarterly decline in Q2 (Apr-Jun) of about 43%. In dollar terms this decline represents a staggering $700 million loss of media investment or circa $70 million of potential media agency revenues. However, SMI’s data shows future demand returning to more typical levels in July and August.
Outdoor had another painful month with -71% while Radio was not far behind with -56%. Television was down -36% and Digital was -26%.
In this desolate environment, the only major product category reporting any growth is Domestic Banks with their total bookings up 6.2% in May. Among smaller categories there has also been growth in the In-Home Entertainment and Household Supplies categories. But unsurprisingly large categories such as Automotive Brand (-62%), Restaurants (-43%) and Clothing/Fashion Accessories (-76%) are reporting significant declines. And the Travel category, which in May 2019 was the market’s fifth largest, has slumped 92% to now sit in 30th position.
FAST FACTS

- It is physically impossible to lick your elbow…. did you just try to do it??
- Two-thirds of Aussie businesses have suffered a decrease in business revenue compared to last year, with more than three in every 10 estimating that drop to have exceeded 50 per cent. (ABS)
- In 2019, Denmark generated 50% of its electricity needs with solar and wind energy
- Low-income earners have been carrying the Australian economy on their backs since March. They continue to outspend high-income earners across both discretionary and essential spending. (Illion)
- New Zealand was the first country in the world to give all women the right to vote in 1893.

Pearman Pulse - June 2020
WHAT’S NEW IN MEDIA – “PROGRAMMATIC” OUTDOOR

Whilst on the subject of Programmatic, it is the latest thing to hit the Outdoor medium. Just when you thought you were safe from acronyms, the Outdoor industry has introduced DSPs, SSP’s and pDOOH (programmatic digital out of home - in case you didn’t know). pDOOH uses audience data from device ID information (computers, mobiles, etc) to identify behaviours and then analyses the movement patterns of those device ID's and identifies the individual screens that fall within the movement patterns. Therefore the data is still based on a trend and likelihood of a consumer being in front of a sign, not a particular person.
How it works is the Outdoor companies allow Ad Tech companies (eg. Vistar, Hivestack, etc) to sell specific digital sites on their behalf. Clearly they are sites that the outdoor company has not been able to sell in the “traditional” way. At present a number of Outdoor companies are trialling pDOOH although oOh! are not part of the trial. The media agencies buy pDOOH from the Ad Tech businesses, not the Outdoor companies. The biggest difference is the Ad Tech companies sell it on a ‘cost per thousand’ impressions reached as opposed to by week or by month. To determine how many people have been reached at an exact time is certainly questionable in this whole process. Outdoor is a ‘one to many’ medium which does make it somewhat difficult to charge based on specific target CPMs.
pDOOH’s advantage is sold as better targeting, greater flexibility (can easily move or pause a campaign) and ability to buy across all Outdoor companies. On the down side, pDOOH has limits on available inventory and is less likely to factor in the quality of each site. The vast majority of clients buy Outdoor for a mass reach and strong branding so seeing the environment before buying is extremely important.
In 2019 pDOOH accounted for around 2-3% of all Outdoor spend in the U.S. (after 8+ years in market). In Australia it is presently accounting for possibly 0.2-0.4% of spend.
WHO IS SEEING YOUR ADVERTISING???
In the 1800s John Wanamaker (a successful US merchant) is alleged to have proclaimed, “Half the money I spend on advertising is wasted, the trouble is, I don’t know which half”. We know advertising works however determining exactly which placement or why certain advertising worked remains the holy grail. The growth in data and attribution modelling certainly helps but it is still not an exact science and sometimes all the data makes it more confusing.
The first step to establishing effectiveness is to know who has seen the advertisement. For Offline media, we use research such as Morgan (print), OzTam (television), GFK (radio) and MOVE (outdoor) to determine who has the potential to see an advertisement. The systems cannot be exact although the good news is Australia is ahead of most of the world in terms of the quality of research and survey sample sizes vs population.
Once we know who is seeing the ads, we then need to ensure the advertising appeared as booked. For most media there are third party companies that can verify the booked media did in fact appear. On very rare occasions an ad may appear in print that is not legible, or a TV ad is cut short or an Outdoor ad is not posted properly. These cases are very rare and generally have an extremely low effect on any impact. In addition, advertisers naturally get compensation if that happens.
For Digital advertisements, determining how many people have the potential to see advertising is more of an exact science than offline media. Meaning digital is measured on a one to one basis as ads are served to specific digital screens. It is also possible to use an independent third party for impression measurement by using an adserver such as Flashtalking for delivering the advertising to the digital screens. Naturally, the big caveat with digital is “potential to see” as the medium is more susceptible to fraud than offline media. A bot used to be something you sat on but now is enemy no.1 for digital advertisers. Bots generate fake browser data and create fabricated URLs which effectively means no humans are seeing those impressions. Programmatic buys are particularly vulnerable to bots. A recent report from PwC and the Incorporated Society of British Advertisers (ISBA) said 88% of advertising impressions could not be fully traced through a spaghetti map of programmatic suppliers and operatives.
Perhaps the question should not be who is seeing the advertising but how effective is the advertising? That is where digital has a perceived advantage as it is accountable through clicks. That also explains why Programmatic advertising can be somewhat vague as it tends to deliver the lowest cost per clicks even if half the money is wasted. Of course, the most important question is what drove someone to click so you can attribute which half of your advertising worked!
DIGITAL – COOKIES ARE GOING FAST

The privacy concerns around how personal data is being used in the Digital world has ramped up enormously since the Cambridge Analytica data breach in early 2018. The cookies attached to ads to track where people have come from when they arrive at a website will soon be a thing of the past. Users on the Safari browser (the default Apple browser) and Firefox can already no longer be targeted based on their previous site visits (which impacts mostly retargeting and prospecting tactics for display and video activity). Chrome browser representing 50%+ of all internet traffic, will follow and progressively block cookies on its users between now and 2022. Effectively it will be a cookie-less world in digital with no information stored from people web browsing behaviour (interests etc.).
This will mean knowing who has come to a website or retargeting and attribution reporting is going to get a whole lot tougher. Retargeting people who have been to a website has often been the best performing digital tactic for acquisition. It will soon become difficult to build a remarketing audience based on people who have visited your website without completing any trackable action. Facebook retargeting will remain available. In terms of attribution, there will be an increase in unattributed conversions as landings to a website cannot be tied back to users. This will lead to the undervaluing of display and video activity in attribution modelling. Reach and frequency modelling or frequency caps will also be greatly affected.
Before most of the cookie data is cut off it is very important to prepare for the cookie-less world and enact the following.
- Data collection: identify the data that really matters to the business and work towards solutions to capture it more efficiently (site login, lead form, transaction information, etc)
- Data strategy: facilitate easy access and circulation of data between different teams and departments by integrating different tools and bridging the gap in the current setup
- Data activation: build the marketing strategy and customer approach around insights the data provides and ensure it is reflected in the campaign execution.
- Measurement: identify how the current measurement will be impacted and define the most appropriate solution to overcome this challenge (eg. Customer life time value, A/B tests, offline & online integration)
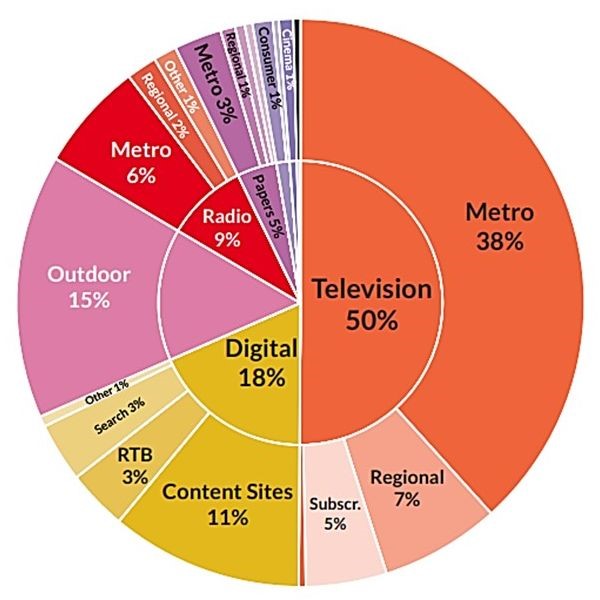
SMI UPDATE – APRIL 2020
The latest SMI figures show April’20 is down around 35% compared to April’19. While March was down 10.6% there was talk that April could decline by 40-50% so perhaps April is not that bad. It is likely April will be the month most impacted by Covid so May and June may be down 20-30%. From Q3 (Jul-Sep), there is a general feeling that things are getting better and it will be a big improvement on Q2 (Apr-Jun).
Cinema was most affected due to not being open. Outdoor suffered greatly
(-60.6%) as April was the height of lockdown and people were not moving around as much. Magazines (-51.8%) were next although ad spend is likely to get worse for that sector as it suspended many titles in May. Surprisingly, Radio was next worse at -43.7%. Radio tends to carry a lot of direct and smaller businesses who have suffered most during the lockdown. Digital, Television and Newspapers were down 25-35%.
Auto (-46%) and Travel (-77%) once again showed the biggest declines. Whilst Domestic Banks (+16%) and Government (+20%) certainly helped the market.
FAST FACTS

- Disney Plus has over 2 million viewers after only 4 months
- The Unicorn is the national animal of Scotland
- Google receives over 83,000 searches per second on any given day
- In Norway, every resident has their income, tax paid & total wealth on public record – no secrets there!
- North Korea and Cuba are the only places you can't buy Coca-Cola
- The dot above an “i or j” is called a tittle

Pearman Pulse - May 2020
WHICH CONSUMERS WILL LEAD US OUT OF THIS MESS

(Author: Dr Ross Honeywill - www.premium.net.au)
The architects of recovery will not be economists or politicians - they will be consumers. It will be a two-speed recovery and the fast lane will be driven by a band of recession-busting consumers known as the New Economic Order.
Consumers are, after all, the ultimate shareholders of the consumer economy, so ignore the future-shapers at your peril. So, who are they, and what are the building blocks of the next normal?
Twenty-four percent of consumers, the New Economic Order or NEOs are already shaping their new reality; and planning for what it will look and feel like to come out of the COVID lockdown. There are 4.7 million NEOs in Australia, 60 million in the US, and they are not called the New Economic Order for nothing – they are the most economically valuable consumers in the economy. History shows that if you follow them, you will find a better future.
The culture that emerges after the looming recession will be characterised by 10 pillars:
1. Purpose & Meaning ("If I’m not fully immersed, I’m just a spectator")
2. Control ("We’re taking back control – in every part of our lives")
3. Sustainability & social conscience (donate, protect, care, support, foster)
4. Hyperlocal ("At home or across the globe, I want an intensely local experience")
5. Human scale (authenticity, artisanal deliciousness, and beauty)
6. Think Small ("Stop shouting at us, we just want the quiet truth")
7. Inconspicuous consumption (experience something extraordinary that just fires)
8. Digital acceleration (expanding new online channels, live streaming & connectivity)
9. Post-material mindset (betterment in mind & body, art, culture, personal challenges)
10. Inclusion (a hyper-focused subject or purpose in online communities of interest)
Intelligent business leaders are already charting the new course back to growth. And the starting point is the consumer who embodies all 10 recovery pillars – the NEOs.
History and data science give us a glimpse into why this is an economic imperative for business.
Fundamentally, NEOs are more resilient than low-value Traditionals. Looking back on the economic impact of 9/11, SARs and the GFC, the data reveals that while NEOs may halt their spending on luxury products and experiences during the deepest period of uncertainty, they never stop their elective spending.
Then they’re back spending, borrowing and investing across the board sooner and more frequently than anyone else. And they recover months, even years, ahead of Traditionals. This reflects a NEO’s sense of their own ‘individual economy’ shaped by desires, personal confidence, optimism, imagination, and prospects. This is radically different from a Traditional’s reliance on perceptions of the traditional economy as their bellwether.
After the GFC of 2007/08, NEOs recovered sooner and their recovery rate was much faster. NEO resilience explains why by mid-2009 NEOs were 20 points ahead of Traditionals in consumer confidence (Roy Morgan). And by 2010 the lead had stretched to 24 points. Fast-forward a decade and the confidence gap between NEOs and Traditionals is still more than 20 points. It is systemic
A resilient consumer brand needs resilient consumers. So, as the COVID-induced recession bites, the smart money's on the future-shaping NEOs to keep spending through the crisis and be back driving the fast lane of recovery, first and fastest. Australia’s 10 million Traditionals will remain stuck in the slow lane.
WHAT’S NEW IN MEDIA – SPORTS SPONSORSHIP FINANCIAL WOES
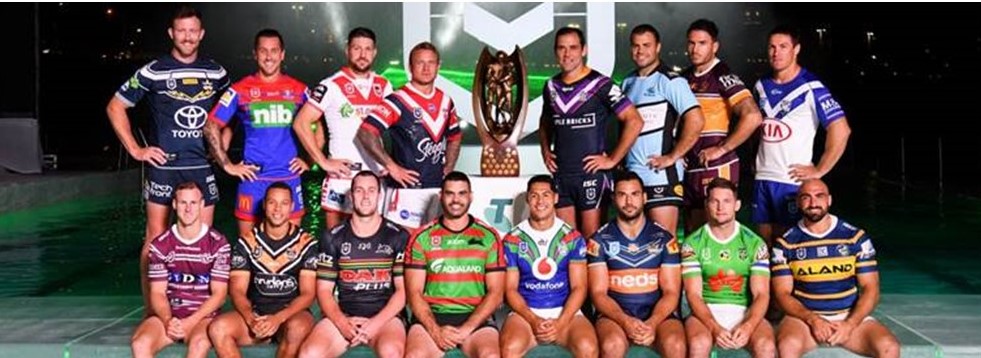
It is a safe bet that all sporting codes are going to be very nervous negotiating their next broadcast deals. The deals are done on 4-5 year commitments and as per below its getting much harder to justify the spiraling increases.
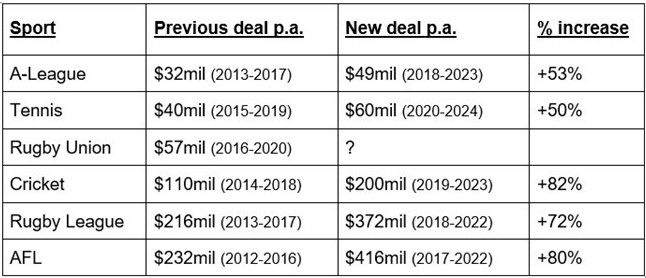
Rugby is in the midst of trying to negotiate but it is generally thought they are being offered half of what they were getting at around $30mil per season. Rugby League and AFL will be the next to negotiate and must surely be apprehensive about their sponsorship deals. Sport has traditionally delivered strong ratings however as ad revenues slide or remain static the TV stations simply can’t afford to keep paying more. This will certainly leave the door open for telecommunications companies (who have the money) to become more involved. Optus led the way paying $63million per season for the Australian coverage rights to the English Premier League which has been a big success for them. Either way we think all sporting codes will need to tighten their belts which is probably bad news for your pay packet if you are planning to be a professional sports person anytime soon.
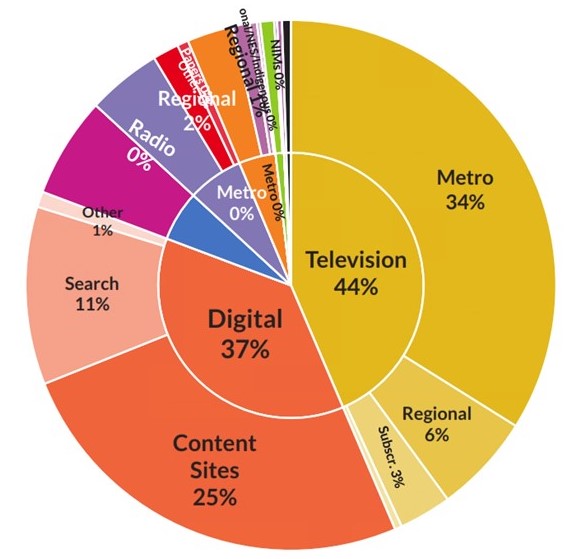
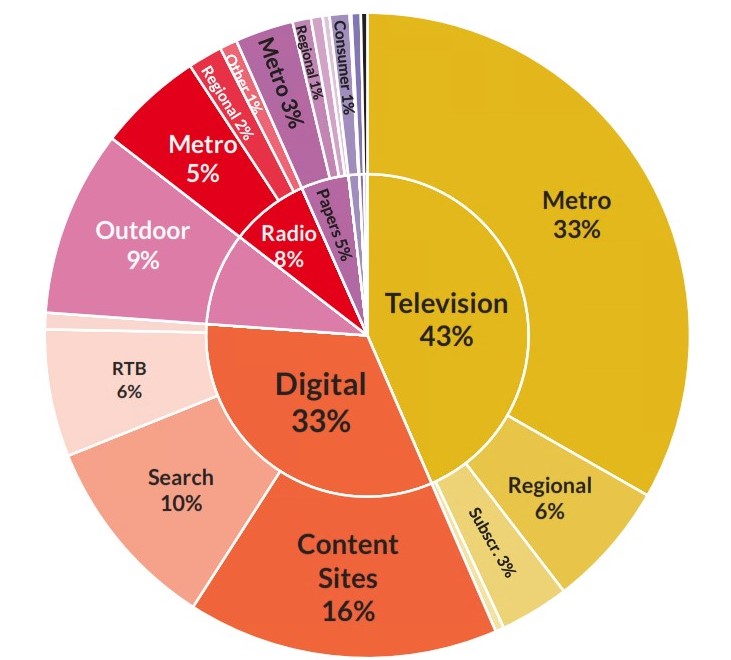
DIGITAL – A DECADE OF SPEND THROUGH AGENCIES*

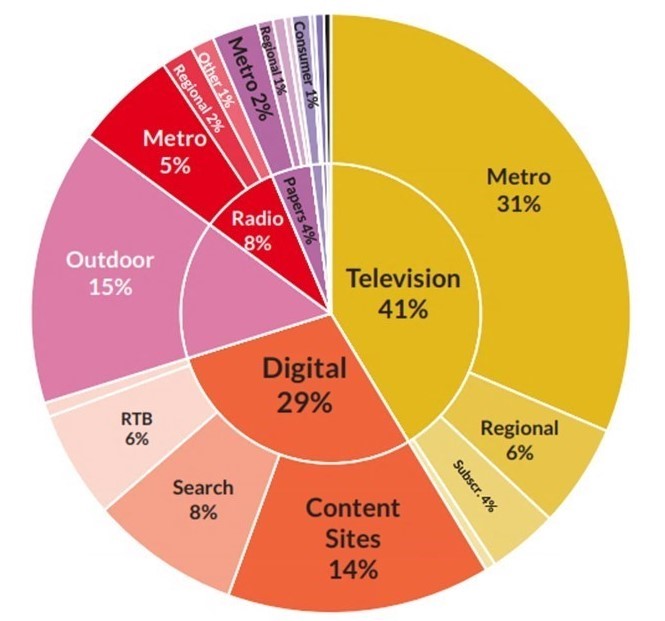
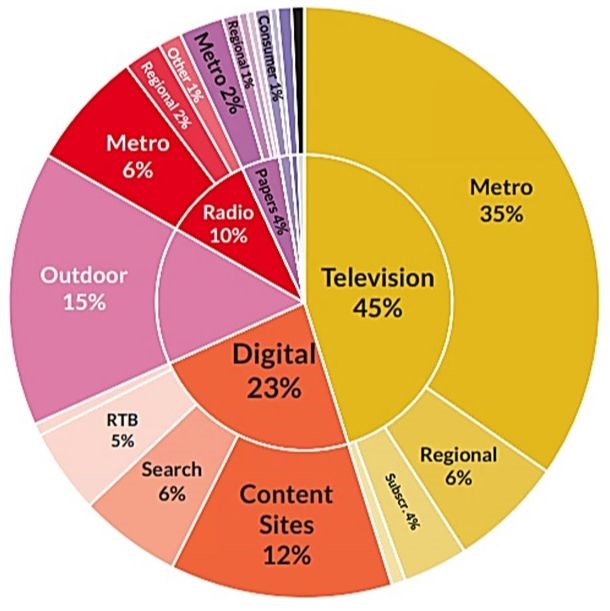
Ten years ago Digital made up roughly 10% of all advertising spend through agencies while today it accounts for 30%. The spend has grown from $700 million to over $2 billion in the 10 years. This was mostly through continuous double digit growth from 2010 to late 2018 when it started to splutter, as did all advertising spend. Digital spend has now been flat for the last 15 months.
Where we’ve advertised in Digital has also changed over the years. In 2010, Google accounted for 17% of all digital spend but today accounts for 36% and Facebook has gone from 2% to 13%. Together they now get 49% of every dollar spent on digital advertising. Nine Digital & News Digital are the next two biggest Networks and together make up a little under 10% of all spend. There has also been a trend to spend with the larger content sites (like Nine & News) at the expense of the very long tail of smaller sites.
How the money is being spent has changed quite a bit with Programmatic making up approx. 20% and Video becoming 10 times more popular sitting at around 25% of spend. HTML5 improved the video experience and its introduction in 2014 on smart phones certainly helped mobile video advertising increase. 2014 was also a big year for Facebook as it introduced “Premium” video ads (playing automatically on a users feed) as well as “Carousel Ads”. This increased Facebooks appeal as well as spend on mobiles.
Virtually all categories have ramped up their digital spend. Auto remains the largest with around $250mil spent annually and has grown from 10.7% share of digital spend to 12.3%. The second largest category, Retail, was spending $18mil in 2010 and now is spending $172mil. Its percentage of all Digital spend has risen from 2.9% to 8.4%.
So the past 10 years has seen enormous changes for Digital with how much we spend, where we spend and how we spend the advertising dollars. Given that it is now over $2 billion through agencies it is not surprising it seems to be settling down somewhat for its place amongst all media.
*Source: SMI
SMI UPDATE – MARCH 2020
The next six months are certainly going to be depressing reading for the SMI figures. March has just been released and is down 10.6% compared to March 2019. The declines can be expected to be more severe in the next few months. Although Covid-19 had some impact in March its real damage will be shown in April-June.
All media suffered and particularly Cinema (-41%) as they were ordered to close on the 23rd March. As usual Print recorded high declines, except national papers, however even Digital was down by 11.9%. In addition to Cinema, Covid-19 is likely to have most effect on Outdoor as people stay off the roads and airports are in lockdown. Auto, Retail & Travel (-33%) continued to decline compared to the same time last year. Whilst Domestic Banks (+35.2%) had a record March spend. Presumably, the Banks had allocated advertising budget for the Olympics which can now be used elsewhere.
FAST FACTS

- Deloitte has put lost wages and profits as a result of COVID-19 at $60 billion in the four months starting from 1 April, with cafés, restaurants, pubs and hotels predicted to take an $8 billion hit.
- Facebook Inc. added warnings to 40 million pieces of misinformation about the coronavirus on its main social network in March to stem the spread of bad advice and misleading articles
- The world’s first website was invented by Britain Sir Tim Berners-Lee in a lab in the Swiss Alps in 1991
- Apple’s “daily” profit for every day of the year is around $163million (USD)
- The average snail has well over 1,000 teeth

Pearman Pulse - April 2020
WE MAY BE APART BUT YOU’LL NEVER WALK ALONE!

When You Walk Through A Storm
Hold your Head up high
And don't be afraid of the dark
At the end of a storm
There's a golden sky
And the sweet silver song of a lark
Walk on through the wind
Walk on through the rain
Though your dreams be tossed and blown
Walk on walk on
With hope in your heart
And you'll never walk alone
You'll never walk alone
Walk on walk on
With hope in your heart
And you'll never walk alone
You'll never walk alone!!
WHAT’S NEW IN MEDIA – CONSUMPTION UP, PRICES DOWN!

Ironically, Covid-19 has inadvertently increased media consumption while at the same time substantially reducing the costs of entry.
Working from home has caused a massive increase in internet usage, Television viewing and news consumption from all sources. From Feb’20 – Mar’20, Social media is estimated to have increased by 211%, News sites by 78% and TV viewing has increased X%.
The media have been hit very hard as around 50% of advertisers have slashed and in many cases stopped advertising. All media have an oversupply of advertising availability and exceptional deals are being done across April – June’20.
Naturally there are clients that have to cancel advertising as their business sector has been stopped or others that have simply sold out of stock. If you have the means, the stock and the financial ability to move your product and protect your brand, it’s a great time to be buying media.
If you invest in the media, they will absolutely support you, especially now. If you thought it may be out of reach, think again. There will be light at the end of the tunnel and it’s a great time to prepare your business for post Covid-19
DIGITAL RADIO BOOMING
Although Breakfast & Drive sessions may be affected by such a large proportion not travelling to and from work, it is clear the digital side of Radio is booming. Spotify is also naturally up and unsurprisingly The Police’s “Don’t Stand So Close to Me” saw more than a 135% spike in streams in recent weeks.
Radio tends to do well in times of crisis as people search for the latest up to date news. On the flip side of that there is also a thought that people are tired of hearing about Covid-19 and want a break from it with some music. The feedback from both FM & AM stations is that social engagement is at a record high as well as calls to the stations. This crisis has driven substantially more people to stream Radio across devices such as computer desktops, TVs, smart speakers, mobiles and gaming consoles. As a result, Podcasting is up 30% over the past month, TuneIn Radio is up 22% and google searches for Smooth or Nova are up 250%.
Radio is usually done through printed diary system left at people’s houses. Covid-19 may change this forever (more online measurement) as well as changing listening habits to be more digital based. Interesting times ahead – stay tuned!
SMI UPDATE – FEBRUARY 2020
February has just been released and no surprises it was down around 5% compared to Feb’19. The last time the Australian ad market had any meaningful growth was August 2018 (+3.4%).
All media types were down with Digital & Television performing the “best” with under 2% reduction compared to February last year. Outdoor had it’s worth month since November 2016 and was down 17%. In terms of individual media, the Nine Network was a standout winner as it increased ad revenue by 30% in February.
The Banking and Food sectors increased spend while Auto, Retail and Travel were all down more than 15%. This is certain to get a lot worse in those categories as Covid-19 causes mayhem with advertising spend. From what we can see we estimate advertising spend will be down around 40-50% from April to June.
FAST FACTS
- When at home, 40.2% of Australians like to shut themselves off from the rest of the world (Morgan). This will be helpful in the age of isolation.
- The 1918 Spanish flu was one of the deadliest pandemics infecting a third of the world’s population and killing 50 to 100 million people. Thankfully we now have antibiotics, modern hospitals, intensive care units and a track record of defeating Yellow Fever, Polio, Measles, Mumps & Rubella.
- Remember Ridesharing – Uber naturally dominates but other options & approx. shares include Ola (20%), DiDi (14%), Bolt (4%), Shebah (2%), GoCatch (2%), Rydo (1%) & Shofer (1%) – Morgan report
- TV streaming – AMPD Research estimates Disney+ has gained about 1.2 million Australian subscribers since its local launch in mid-November. Netflix in turn has 5.6 million paying subscribers ahead of Stan with 1.6 million subscribers.
- As at Dec19, Morgan says the most trusted brands in Australia are 1.Bunnings, 2.Aldi, 3.Woolworths, 4.Coles, 5.NRMA. Perhaps after Covid-19 the Banks will have increased consumer trust.
- We analyse what we see and we feel what we hear

Pearman Pulse - Feb 2020
AUDIENCE FRAGMENTATION
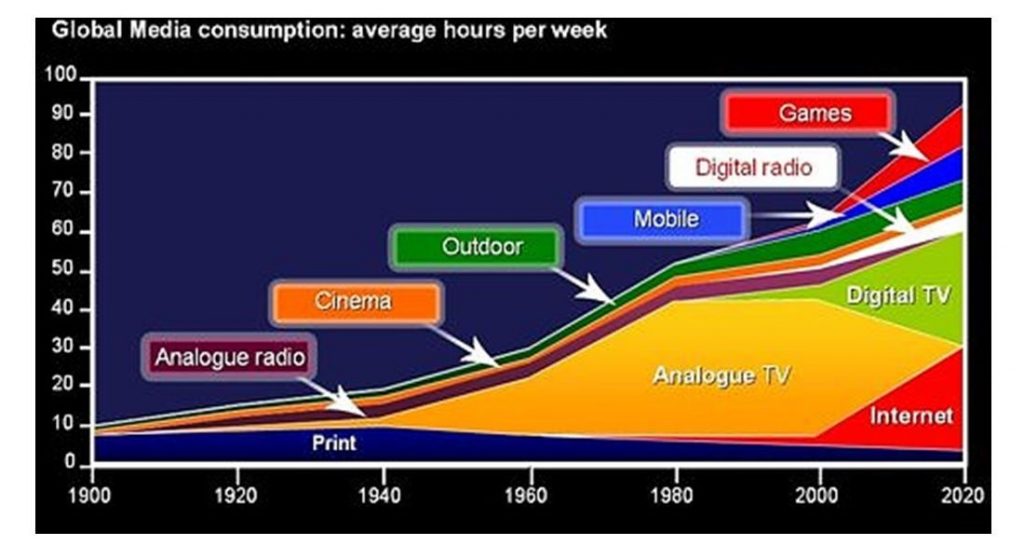
The fragmentation of
consumers’ media consumption over the last 20 or so years has made it more
difficult to reach the masses although has helped in terms of targeting
specific audiences. Perhaps fragmentation has been a curse to mass market
advertisers while possibly helping smaller niche targeting clients.
Stepping back into the mid-1990s Australians only had 5 TV stations (ABC, SBS,
7, 9 &10) to watch. No wonder the average audience of the top 10 programs
across the 5 capital cities was over two million per show. Then along came
PayTV (1995), the free to air digital stations, catch up TV, streaming,
Netflix, Stan and suddenly consumers can watch what they want, when they want
across a multitude of channels. Today’s highest rating TV show is lucky to get over
one million viewers.
Magazine’s readership is now fragmented across their print, App and web
editions. The mass women’s magazines printed versions have had a huge drop.
From 1999 to now, Womens Weekly (AWW) print readers went from 2.9 million per
issue down to 1.3 million per issue, Woman’s Day went from 2.6 million to
877,000 and New Idea went from 2.2 million to 785,000. Considering their total
audience including digital readers, AWW’s total readers are down 13% compared
to 1999, Woman’s Day total readers are 53% less than 20 years ago, and New Idea
is 50% less. In addition to this, the advertising is sold separately i.e. print
or digital. Again, massive fragmentation of the audience.
In the Newspaper glory days (circa 1997), they received over 50% of all
advertising spend while today they get a little over 4% of all spend. The
readership of the printed national papers (The Australian & the AFR) have
declined by 30-40% while the metropolitan papers print readership has declined
by over 60%. Naturally the papers do quite well with their digital copies
however total combined (print & digital) daily readership is still down by
around 25% compared to 20 years ago. Advertising is again sold separately as
print or digital which again fragments the audience for advertisers.
Radio listening has fragmented with the introduction of the numerous Digital
stations, Spotify and podcasts. Even Cinema have fragmented their audience as
there were a little over 1,000 screens in 1997 whilst today there are over
2,300 screens. Nonetheless ticket sales have remained relatively constant over
this time.
The one medium that has grown from zero consumption in 1995 to virtually
everyone today is the internet. Although the internet itself is massively
fragmented as it is all the traditional mediums plus over a billion websites
plus all the social sites. Australians spend up to 14 hours a week on social
media alone excluding time spent online with other media sites.
The combination of most of the media offering far more options and time now
spent online has resulted in the enormous audience fragmentation. This audience
fragmentation has also resulted in the ad dollars fragmenting causing a great
deal of pain across traditional media as Digital now accounts for around 30% of
ad revenue. In years gone by Saturday’s SMH attracted people interested in
News, Real Estate, cars and the “rivers of gold” classifieds. These days
realestate.com, carsales, eBay and Seek have taken much of that audience along
with the ad dollars.
From an advertiser’s point of view, it is clearly harder to reach lots of
people quickly making fragmentation a bit of a curse for mass market products.
On the positive side, data is today’s new currency used to spend clients’ money
more wisely and enables more micro targeting of audiences
ACCC vs GOOGLE & FACEBOOK
Last Saturday, the Treasurer’s Office announced the ACCC will publish an
Ad-Tech Inquiry Issues paper in March 2020 – interesting times ahead!
Back
in December 2017 the federal government directed the ACCC to analyse the
Digital Platforms in relation to consumers, journalism and advertising on those
platforms. By ‘platforms’ they basically meant Google and Facebook. The report
came out in June 2019 and we are now getting to the interesting phase of seeing
what can be done.
In
June 2019 the ACCC said they had serious issues relating to market power of
Google & Facebook affecting the media, advertisers, businesses and
particularly consumers. They were scathing of Facebook & Google as well as
the Digital advertising market. The ACCC had particular concerns that consumers
do not realise how much of their data is collected and what is done with it.
They also said the rise of Facebook & Google had caused significant harm to
the news and to journalism. They said “the use of data can exploit behavioural
biases and consumer vulnerabilities on a scale we’ve never seen before”
The
ACCC recommended a branch to be set up within the ACCC to ensure a great deal
more transparency and oversight of Google and Facebook. This branch will
investigate the serious scrutiny of the algorithms of Facebook & Google
which they believe is anti competitive or misleading behaviour. The ACCC also
made a point about the very opaque and unclear Digital advertising market. They
also want an inquiry into the AdTech systems so they can see who is making
money and at what level. The Government has set up new fines and the ACCC
literally said “they were anxious to use new fines in Australia that will
amount to many hundreds of millions of dollars”.

SOCIAL MEDIA
Social media is the
way for people, brands and groups to communicate and interact online. It has
been around for more than 15 years, but lately we have a seen a surge in both
the number and popularity of social media platforms such as TikTok, Lasso &
Vero.
Social media got its name because users are able to engage with each other in
the form of user generated content, commentaries and many more functionalities
that platforms offer nowadays.
For businesses, a rise in social media brings both opportunity and
responsibility with the amount of data & accessibility that marketers have.
Social Media is an important pillar of Digital marketing and it helps brands
accomplish the following goals;
• Community building
& brand engagement :
o Making it easier for brands to talk and address their audiences
o Brands can now more easily announce new products and business developments to
their audience
o Promote events and increase both registrations and attendance
• Brand awareness
& discovery
o Brands can now build awareness through social media with organic social and
paid ads
o With social media it has become easier to discover a brand – through friends
recommendations, influencers and ads
• Websites traffic
& sales
o Increasing site traffic, driving leads and sales as a result of organic
social activity and ads.
Below are the top Social platforms in Australia by number of monthly Unique
Users (source Nielsen Dec 2019):
Facebook: 17,834,000
Instagram: 12,484,000
LinkedIn: 9,679,000
Twitter: 8,365,000
Pinterest: 7,171,000
All the major social networks offer paid advertising options. Social media
advertising allows brands to reach a wider audience than those who are
following them. The advertising options are ever evolving on Social platforms
and they include demographics and detailed targeting options with variety ad
formats to reach your desired audience and achieve your brand goals.
SMI UPDATE - JANUARY 2020
January is
traditionally the smallest ad spending month in Australia so the figures never
look that great. The interim January figures have just been released and it
looks like we are kicking off 2020 the same way we ended 2019 – a negative year
on year performance. The January figures are approximately 10% down compared to
January 2019. This excludes the Digital bookings although once the Digital
bookings are added we expect to still be in the negative.
The Automotive and Retail categories continue to be in the ‘Top Declines’ for
the month. Perhaps not surprising given the bushfires, Travel spend was also
down. All the media are down although the one spot of good news was Street
Furniture had a substantial increase from January 2019

1. A 30 sec TV ad in
the 2020 Super Bowl was around $5.6million USD
2. More than $500 billion a year is spent on advertising worldwide
3. 4 million Australians aged 14+ (19.1%) now use meal delivery services, up
from 1.98 million (9.8%) Interestingly ‘Food Delivery Services’ advertising has
grown 4 fold since 2016 to $42 mil in 2019
4. Only 12% of Australians expect 2020 to be better than 2019. This puts us
43rd of 47 countries … at least we’re more positive than Italy (11%), Jordan
(7%) and Lebanon (5%) – Roy Morgan

Pearman Pulse - Jan 2020
THE LIFESPAN OF BRANDS

An interesting topic given the news that Jeanswest (48 years old) and McWilliams Wines (141 years old) have recently gone into administration. Perhaps those brand names will carry on but there have certainly been some big names that no longer exist. Remember MySpace, Ansett, Grace Brothers, Pioneer, HIH Insurers, Cosmopolitan Magazine, Fairfax, Dick Smith and Gowings just to name a few.
In our own back yard, the advertising industry has not been great in maintaining their own brands. At one point George Patterson, J Walter Thompson, Leo Burnett, Lintas, Mitchells and Merchants ruled the Australian Advertising market.
Occasionally brand names get second lives. The Bank Of Melbourne was taken over by Westpac in 2004 who replaced the name (to Westpac) and then revived it back to Bank Of Melbourne in 2011. Caltex petrol stations have also recently announced they are rebranding back to Ampol after they killed the brand name back in 1995 when they merged.
Then there are the brands that have survived 100+ years such as Panasonic (started in 1918), Kikkoman (1917), Coca Cola (1886), GE (1892) and Fiskars that was founded in 1649. The record for the oldest brand name seems to be 1,400 years by a Japanese construction company called Kongo Gumi (founded 578) which unfortunately failed in 2006.
Brand names disappear for 3 main reasons, 1) they’re rebranded 2) they don’t embrace change or 3) they run into financial troubles.
Company takeovers are often the cause of a brand name changing such as Grace Bros becoming Myer or Fairfax becoming Nine. This often seems counterproductive given the time, effort and money it takes to build a brand that the population has an affinity with. Then there is the fact that the world is constantly changing, placing pressure on businesses to stay relevant. There have been many examples of market leading brand names that didn’t adapt to the new environment e.g. Blockbuster Video, Kodak film and Remington Typewriters. The third reason is a little more obvious when businesses get into financial difficulties due to numerous causes. Some companies don’t keep on top of accrued liabilities such as tax or get into trouble due to cashflow shortages. Of course, simply not having enough revenue to cover costs is always going to be a problem.
In 2020 Brands are under more pressure than ever as the average tenure of Chief Marketing Officers (the brand’s guardian) gets shorter each year. This means there are so many more people given the task of custodian across the brands lifespan.
The question of the lifespan of a brand is unfortunately a bit like how long is a piece of string? Brands survive when they a have a consistent, credible personality that creates and holds a relationship with a customer. Like all relationships, they must grow, develop and change meaning brands need to be flexible and willing to adapt to secure a longer lifespan.
'VOZ' - TV MEASUREMENT
The latest Television audience measurement tool in Australia is
due to be released in Feb 2020. “VOZ” will combine the audience for
Broadcast TV (viewing on a TV screen as the program goes to air) with the
audience of people watching TV programs either streaming or using catch up on
TV screens, laptops, phones & computers. The aim of VOZ is to deliver an all-screen,
de-duplicated picture of what Australians are watching, who is watching, and
how they are watching. This will enable clients to know their Reach &
Frequency across the numerous devices that TV is now watched on.
To determine the combined R&F and create a media profile of Australian
households and people, VOZ will combine the following data sources;
- television ratings currency panel data from over 12,000 individuals in OzTAM’s in-home broadcast TV measurement (TAM) sample;
- streaming television meter data from more than 1,300 TAM panel homes;
- online TV content viewed on 7 million connected devices (OzTAM’s Video Player Measurement service);
- population information from more than 50,000 establishment survey questionnaire responses per year for the TAM service; and,
- Australian Bureau of Statistics population data.
VOZ will allow us to better target viewers on both demographics (age, sex) as well as interests and needs (e.g., pet owners, mortgage-holders, frequent travellers, health conscious). It will also allow the overlay of external (first, second and third party) data sources to further support advanced audience targeting.

THE FRENEMY OF TRADITIONAL MEDIA
The WWW started out as one medium but ‘Digital’ is now
integral in every medium. It has been both a sinner and a saviour for
most media. Print was first to see ad revenue walk away as their audience
consumed digital news. Although now News Ltd’s digital ad revenue is around 2.3
times more than it is losing in print revenue based on SMI data. Magazines
don’t do as well and their digital ad sales are only delivering around 50% of
the ad revenue they are losing in their printed versions. The Outdoor medium
has probably gained the most as they embraced digital and converted many of
their hero sites to digital often costing north of $1mil to convert a single
road supersite. This has no doubt benefited outdoor and massively increased
their inventory (number of facings they can sell).
Television’s audience has fragmented however the networks have picked up
revenue from selling ads when people are viewing on digital devices. Digital
has also given them far greater audience targeting ability via BVOD (broadcast
video on demand). It is a bit harder to determine the digital effect on Radio.
Digital has allowed Radio to produce DAB+ niche stations such as coffeeFM,
buddha, etc and potentially they have affected ‘tradional’ listening by around
10-15%. Spotify and its ilk seem to have replaced albums, cassette tapes and
CDs with less affect on mainstream listening. Podcast listening is now
around 15 minutes a day and mostly for the under 40.
SMI UPDATE - DECEMBER 2019
The “interim” December figures have just been released and unfortunately the figures don’t look great. Once December is finalised it is reasonable to assume the annual (Jan-Dec) advertising pie that SMI measures will be around $6.8 billion. We have to go back to 2014 the last time SMI reported an annual figure below $7 billion. This means the 2019 advertising market will be around -6% compared to 2018.
Once again, Outdoor is the best performer in December with a record December month of $83 million which is up slightly on Dec’18. Digital spending continues to plateau albeit off a very large base.
There is no doubt that 2019 will go down as a bad year for most media on a comparative year to year basis with record decreases in ad spend. Television will be down around -7%, Digital down approx. -1%, Outdoor approx. -3%, Radio around -6%, Cinema about -5%, Newspapers down -16% and Magazines around -17%. The reduction in the Automotive, Retail and Gambling categories contributes around about 30% of reduced spend.

FAST FACTS
1. Watches are always set to 10:10 in ads because it frames the brand name and supposedly the watch looks happier
2. 2019 was the second warmest year on record since 1880. The warmest year to date was 2016.
3. The world’s most expensive ad is believed to have been $33 million spent by Chanel in 2004 with Nicole Kidman and directored by Baz Lurhrmann for a 2 minute ad. https://www.youtube.com/watch?v=yTO4FHf8MBs
4. Bushfire donations are fast approaching half a billion dollars – possibly Australia’s biggest fundraise
5. Mark Edmonson was the last Aussie male to win the Australian Open back in 1976. He wore a pair of Dunlop Volleys and beat John Newcombe.

Pearman Pulse - Dec 2019
60 SECONDS WITH AUSTRALIA’S MOST EXPERIENCED ‘MEDIA GUY’

Steve Allen has been a mainstay of the Australian Media scene possibly since the Jurassic Age. At any rate we know his media career started when Television was black & white, Newspapers (print versions) were a growing media and FM radio was not even thought of. Digital media was generations away and computers were only used to send people to the moon. Steve has the wisdom of living through so many changes in media and working with so many clients that he really is a media treasure trove for our industry. So, we thought we’d put a few questions to him.
How / why did you get into advertising? I left school before my final year as I wasn’t enjoying school and wanted to get into the workforce. My Uncle (who was twice voted Sydney’s best dressed man by the Daily Mirror), was a Publication Representative. He had relationships in Advertising Agencies and I got a job at Times Advertising which was becoming SPS. I learnt everything; Production, Creative, Accounts, Media, Account Service
Your toughest boss? Probably David Baker at McCann Erickson, but really I consider Clients as the real bosses for what I do. In those all really bright people constantly thinking about improvements in their business. Mal Quin of Tip Top Bakeries, Rentlo, Bob Miller of Toyota, David Hollott of Citibank, Ted Waters of ING/Mercantile Mutual, Ian Dear of Australian Sugar Industry, Liz Katsiotis of Ateco/KIA
The smartest people you’ve worked for? Bob Miller, David Hollott, Karim Temsamani, David Burkett, Mark Kelly
Lessons learnt about business & life over such a long and distinguished career? Be upfront transparent and honest. Tell clients what they should do…if it were my $$ etc. Developing a Media Marketing strategy is everything. Work in the clients interest, not the Medias. Never paint the grey…always make things black and white. Take the long view in developing business.. Always come up with new Media Marketing ideas or possibilities (annually at least). Use research to arm clients better and get them closer to their customers.
What makes a great client? Clients who metaphorically speaking, or actually, have skin in the game. Clients committed to doing things better and beating their competition. Clients who love sharing results and asking how we could do it better.
What makes a great media relationship? Honesty and transparency (within reason). Media’s job is to sell up. Our job is to achieve value (they are not the same thing).
What is the best campaign you’ve worked on? Toyota - Oh What A Feeling! Consumer ranking went to #1 or 2 in all scores within 24 months whilst still being outspent.
MORGAN NEO PRESENTATION
The NEO typology is a sociographic consumer classification based on an algorithm of 100 behavioural factors, 82 attitudinal factors and 12 elective spending factors. The algorithm sits inside the Roy Morgan Single Source database. But more than a typology or an algorithm NEO is a Premium mindset, Premium state of mind and Premium way of thinking.
The flipside of the NEO mindset is the Traditional mindset. Consumers with the traditional mindset want the best price. best deal and are motivated by features, functions and status. These two mindsets are so completely different they may as well be on two different planets – which one are you?
DATA, DATA, DATA!

The use of Data to refine media buys has been around for many years although the proliferation of Data and Suppliers is immense. The amount of data on all of us is growing astronomically as we continue to leave a digital footprint, use more loyalty cards and become a cashless society through the use of cards. Data is used across all media but is particularly effective across Digital, Outdoor, PayTV and BVOD (Broadcast Video On Demand).
Some of the bigger “Transactional Data” suppliers include:
• Quantium – their data comes from NAB customers and Woolworths Rewards customers as well as RP Data for properties and Foxtel consumers
• FlyBuys – get their data from Coles, Kmart, Liquorland
• Ticketek – every time you buy a ticket your data is stored
• Roy Morgan – survey 55,000 people to determine what people buy
There are also ‘Data Aggregators’ who gather data from numerous sources such as the Census, Australia Post and popular websites. The Aggregators are companies like EYeota, LiveRamp and Experian.
There are also industry specific data covering Travel & Auto. Red Planet (owned by Qantas) and Adara & Sojern cover a collection of airlines and hotels. A360 is an Auto data player getting data from carsales.com.au.
The media vendors also have their own data although since the Facebook data breach issues Facebook, Apple and Google presently do not ‘mix’ their data with other sources. Media such as Nine and News Ltd do combine their data with other sources to maximise targeting.
Having all this data at our disposal is certainly helping us make more informed decisions around media.
SMI UPDATE - NOVEMBER 2019
The interim November results were released on Monday with year on year results continuing to be negative. That’s now 15 months in a row. SMI’s early November data is showing the market back 12.9% (ex Digital) at $436.1 million.
The major problem facing the market is far softer demand from Retail advertisers with SMI’s early data showing total Retail spend to be back 19.8% with that large fall having greatest impact on Television and Radio media. The 2018 November figures also included spend for the Victorian election and the beginning of the lead up to the Federal election.
But the new competition in home delivery has seen the Restaurants category grow ad spend 11.5% already in November, and the emergence of Disney+ and Apple+ in the In Home Entertainment category has resulted in that category’s ad spend lifting 62% this month.
The Outdoor media has emerged as the best performer in November, and the only media to report growth, with its early bookings already up 0.3% to a new November record level of $97.7 million. This will be welcome news to Outdoor who have only had 3 positive months since January and previously had many years of growth in ad spend.
The softer demand unfortunately continues a trend we’ve seen all financial year and calendar year, with bookings for those periods now back 7.5% and 5.8% respectively.
FAST FACTS
1. The first song ever played on MTV was ‘Video Killed The Radio Star’
2. Greta Thunberg may be this year’s Time Person of the Year but knowing Adolf Hitler was Person Of The Year in 1938 does take some shine off it
3. Australian Consumer Confidence is the lowest its been in more than four years
4. Netflix topped the Morgan Christmas list, nominated as ‘really cool’ by 66% of 6-13 year olds & more than 70% of 10-13 year olds.
5. The fireworks budget is estimated at $6.5 million to ring in 2020, which is up 12% on last year.

Pearman Pulse - Nov 2019


BUYING MEDIA - LITERALLY!
We all work in the media business but have you ever thought about investing in it? If you don’t have a lazy $1.1 billion hanging around to buy APN Outdoor (as JCDecaux did last year) then perhaps the share market is the next best thing.
Looking at the returns over the last 5 years there are no prizes for guessing that anything Digital has achieved mammoth returns. If you bought Netflix shares in 2014 you would now be 430% richer on those shares. The Facebook share price has increased 155% and Google 135%. Closer to home, REA Group (realestate.com.au) achieved a 130% return and Carsales.com delivered 45% return. Surprisingly Domain Holdings, the digital property business founded by Fairfax, has had a 15% decline since it was listed in Nov’17.
The clear ‘share price’ winners from the ‘traditional’ media sector are the Outdoor companies. oOh!media realised a 52% return over the past 5 years although this would have been far greater had it not been for a downgrade in its FY19 profit forecasts. QMS also achieved a 65% return from its listing 4 ½ years ago thanks largely to Quadrant Private Equity recently wanting to acquire the business. The next best traditional performer over five years is News Limited with a 14% return and presumably their majority ownership in the REA Group has helped. If you had bought shares in any other traditional media such as Television (Seven West, Nine, Prime), Radio (SCA, HT&E), Cinema (Village Roadshow) or Direct Mail (Salmat) you would have unfortunately lost between 10-75% of your money since 2014.
The media that you can’t buy as they are privately owned include TEN (owned by CBS), WIN (Bruce Gordon), Nova (Lachlan Murdoch), JCDecaux and Bauer Media. QMS look to be soon joining this group.
Most of the media companies’ income is derived from advertising revenue so it is unsurprising their share prices are not overly strong at present due to the soft advertising market. The good news for media share investors is a general feeling that advertising spend will pick up in 2020.
CH7 PROGRAMS COMING IN 2020

The Seven Network seem to have the most to crow about for 2020 with more new programs, more revamping of old formats and the Tokyo Olympics across July & August. Their new programs include ‘Pooch Perfect’ hosted by Rebel Wilson – how can a show about people pandering their fur babies not rate? One potential rating hit could be ‘Mega Mini Golf’. Yes, Mini Golf! Think Mini Golf mixed with Ninja Warrior. They also have ‘SAS Who Dares Wins’ plus another cooking show called ‘Plate Of Origin’. The programs they are giving a second or third life to include ‘Farmer Wants a Wife’, ‘Royal Flying Doctor’ and ‘Big Brother’ – all previously on Nine or TEN.
SEARCH ENGINE MARKETING (SEM) – BEGINNERS GUIDE

SEM is often seen as the must use medium in any advertising campaign as you are bidding for people who are actively “in market” for your product. The good news about SEM is you only pay if someone clicks on your ad, the bad news is Google does not release the secrets to its algorithms for maximum impact. The algorithm determines where the ad will appear and takes into account many things including the amount of the bid, how optimised your website is, relevancy of the ad and clicking trends to date. Google clearly wants to maximise profits but needs to balance that with ensuring the consumer has a good experience.
To plan an SEM campaign we use the ‘Google Keyword Planner’ which shows a range of costs required for particular keywords or phrases. Each keyword or phrase will have different costs depending on how competitive the bidding for those words are. Constant monitoring responses for each keyword or phrase is crucial to stay on top of results, maintain the right bidding strategy and stay ahead of the point of diminishing returns.
To determine the amount that should be spent on SEM you would need to review the conversion rate from ‘click’ to ‘acquisition’ (albeit sales, website visits, etc). You can then determine what a reasonable amount to spend on each click would be and bid accordingly. Naturally SEM will always perform well for ROI as it is at the end of the marketing funnel and targets category buyers as opposed to sheer demographics. However, when clients are running high impact ad campaigns their SEM regularly performs a great deal better. Of course if you’re not happy with Google’s dominance you can always buy SEM on Bing however that only has around 3-5% of the Australian market.
SMI UPDATE - OCTOBER 2019

The interim October results were released last Friday and are yet to show any signs of an advertising recovery. Excluding Digital (final results come in two weeks or so later) SMI’s early October figures show a 12.4% fall in Agency bookings compared to Oct’18. It is always dangerous to read too much into single month figures as major events or numbers of weeks in the month can affect the figures.
For the Jul-Oct19 period (FY20) vs STLY, Cinema is actually up 30% and Television is performing the next best but still at -6.5%. Although Outdoor and Radio have increased their ad revenue consistently over a number of years they are now showing -8.5% and -9.0% respectively for FY20.
The categories with the biggest declines in advertising expenditure for FY20 include Automotive (-$28mil), Banks (-$18mil) and Food (-$17mil) while the Insurance category (+$25mil) is helping minimise the overall advertising decline. The general consensus is for the ad market to improve in the second half of FY20 but unlikely to be sufficient to offset the downturn in the first half.
FAST FACTS

- Small businesses still owe the ATO $16.5 billion for FY19
- 50% of Australians have just 3.6% of national net wealth (Morgan wealth report)
- 2019 Melb Cup … yay or neigh
- TV viewing was down 27% vs 2018
- lowest attendance at Flemington since 1995
- betting was down approx. 6% - One in four small business owners intend to quit in 3 years (AMEX report)
- We know how to spend – Australian 2019 Christmas retail sales (12th Nov – 24th Dec) expected to grow 2.6% to $52.7 billion (Morgan / ARA)

Pearman Pulse – October 2019
RELATIONSHIPS GROW THE BOTTOM LINE

We all inherently know strong relationships are crucial in business whether it be a buy/sell relationship or at the company we work in. Particularly given we invariably spend more time with our work colleagues than we do with our own families. It seems not enough attention is focused on developing relationships and it is rarely talked about.
In the media business we are often presented with the latest and greatest Research, Data insights, Ratings and slick presentations. These are all important, however, strong relationships trump everything. The advertising business is a people to people business (yes, it still is despite programmatic buys, etc) and there is no doubt we all prefer to buy off people we trust, respect and basically like. When you have a strong relationship with someone, communication is at its highest and that person gets the last chance to lose the business. Naturally they still have to earn the business by presenting the best proposal.
Continuity of staff absolutely helps to build strong relationships and some of the strongest relationships we have are with people who have been at the same media for many years. It is no coincidence that the media who create the best relationships tend to be the ones with the lowest turnover of staff.
In the media business we deal with the same people each day, week and month making business relationships even more important. The significance of a strong relationship is clearly evident as the media that nurture and develop strong relationships often over index on their share of the advertising dollars. The advertising business deals in billions of dollars annually and even if a strong relationship only results in a 2-3% advantage that still equates to hundreds of millions of dollars.
So, what’s the magic formula for developing strong relationships? A difficult question to answer due to the complexity of human behaviour and our individual uniqueness. Finding common ground, time and being reliable is a good start. Unsurprisingly trust, respect and open communication is often talked about in developing solid relationships. In this ever increasing computerised age relationships still make the world go around and even more so in the media business.
WHAT'S NEW IN THE MEDIA - FTA TV UPFRONT SEASON

10 and 9 have presented their 2020 schedule in the last two weeks while Ch7 is presenting next week and SBS in mid-November.
Ch10 kicked off the Upfronts with a ‘steady as she goes’ message. Not a lot of changes although the new Masterchef hosts were introduced - Jock Zonfrillo, Melissa Leong and Andy Allen. Masked Singer has also rated well enough to be returned in 2020. They reinforced that CBS is a unique and powerful ownership.
Nine wheeled out their stable of stars over the 2 hour presentation headlined by Hamish & Andy. To compete with Ch7’s Olympics in 2020, Nine are cleverly offering 4 clients a consistent exposure to “own every moment” of the Australian Open, Married at First Sight, The Voice, Australian Ninja Warrior, Lego Masters, State of Origin, The Block + more. Nine also made it very clear they were out to recoup some of the $700 million of advertising revenue that Facebook and YouTube have taken from TV. As usual Nine ended their Upfronts with an impressive party (complete with rollercoaster) at The Entertainment Quarter.
DIGITAL UPDATE - YOU'RE THE VOICE....try and understand it, make a noise and make it clear
“OK Google”, “Hey Siri” and “Alexa” are without doubt becoming part of the vernacular in many Australian homes today. Mostly to play music, ‘fact check’ arguments, wake people up, boil an egg, etc. As these virtual assistants are used more and more to search for products and services it will be interesting to see what effect it is going to have on SEM and SEO and in particular Google.
Google must be working on how best to monetise voice searches as more people talk to their devices. Although the lack of data measurement for voice commands probably means Google has some time on its side. Perhaps the increase in voice searches could deliver a great deal more searches for Amazon (via Alexa). A voice search can realistically only put up one or two options for a product search and the question would be how could they charge for that. Marketers will need to consider the differences for when potential customers search using their fingers vs talking to a device. Instead of keywords on text search, users tend to use longer sentences formed as questions or commands for voice search. Hence, marketers need to include longer keywords and instead of optimizing on keywords they need to optimize for the full question.
Audio searches also have the potential to cause some confusion with brands such as Audi or Aldi. Companies’ websites need to ensure local information such as phone numbers, opening hours and other information are up to date on all different platforms as most users tend to search for products near to them. At present Google’s responses to voice commands are based on most relevant websites and proximity. If voice searches really take off, marketers need to make sure their content is easily understood and can quickly answer the different types of questions users are asking.
SMI UPDATE

Australia’s media agency market is close to returning to growth, with SMI’s early September data showing the market is back only 3.4% when Digital bookings are excluded, and remains on
track to meet SMI’s forecast for growth in October.
SMI’s ad intel shows total TV bookings back just 1.7% (and Metropolitan TV essentially flat, or -0.3%) despite the NRL Grand Final broadcast in October rather than September as was the case last year.
And Outdoor ad spend has grown in September (+3.5%) but may in part be due to five Mondays falling this month so the month’s data may feature extra revenue from Outdoor campaigns sold in two week cycles.
And while the Radio media usually benefits from months featuring an extra Monday, the early data shows Radio demand so far back about 6%.
FAST FACTS

- Christmas is starting even earlier - in Sep 2018 Christmas recipe searches on taste.com.au were up 263% YoY
- The Teacher's Pet Podcast is the number 1 piece of content ever exported with more than 49 million downloads
- Merely 6% of China’s 1.4 billion population have a passport – imagine the potential if that grows
- Don’t blame the US for Halloween, it’s origin come from the UK
- Only around 10% of Australians now smoke
Pearman Pulse - September 2019
TELL HIM HE’S STREAMING!

It
could be argued Television viewing has changed even faster in the last 6 years
than ever before. The very definition of what it is to watch TV has been
challenged by the introduction of the streaming services which have now well
and truly infiltrated mainstream culture. The average user is consuming
approximately 10 hours of ‘streaming’ TV a week.
Watching Television via the internet on TV screens, phone apps, computers and
tablets has grown enormously in Australia as bandwidth has expanded and data
prices have come down. It began with the Government stations introducing
streaming catch up services for ABC iView in 2008 and SBS On Demand in 2011.
Network 10 introduced their catch up in 2013 (10 Play) and followed by 9Now and
7Plus a couple of years later. The giants of streaming TV, Netflix and
Stan, started in Australia in 2015 while Amazon Prime Video arrived in 2016.
In terms of paid streaming, Roy Morgan estimates around 55% of Aussies have
streaming services otherwise known as subscription video on demand
(SVOD).
Although paid streaming is increasing its footprint in the TV landscape,
Traditional TV still accounts for 46% of viewing while SVOD accounts for around
35%. The bad news for Traditional TV is SVOD viewing is growing and making it
harder to reach substantial audiences. This is also bad for advertisers as SVOD
is yet to carry advertising however the subscription model of revenue has
proven a struggle in what is a seriously competitive market. Netflix’s
debt continues to grow and at Jun’19 was around $24 billion (USD). We’ll say
that again, $24 billion!! They paid approximately $420 million in interest
alone in 2018. Without a continued increase in subscribers they could run
out of cash suggesting they may be forced at some point to incorporate
advertising onto their platform.
Foxtel joined the streaming revolution back in 2013 with the launch of Foxtel
Now which has now just been moved to the Foxtel Go app. As Foxtel
continues the battle against soaring sports broadcasting rights and pressure on
subscriber numbers they have also recently launched Kayo Sport as their
streaming sports platform. Since its introduction in November 2018, the
number of Kayo users has continued to grow with the latest figures revealing
331,000 subscribers nationally.
While Kayo seems to have sports streaming in Australia covered for now, regular
drama streaming is set for a big shake up. Apple TV+ is launching in
Australia on the 1st November at $7.99 per month and will be giving
buyers of an iPhone, iPad or Mac a free year of streaming. Apple is
reportedly prepared to spend billions of dollars to establish itself in the
market. Then there is the might of Disney that is coming to our shores on
the 19th November with the launch of Disney+ and its enormous amount
of in demand content.
Although these new entrants will continue to fragment TV audiences, streaming
could be highly beneficial to commercial TV with its ability to collect a great
deal more audience data and possibly deliver similar benefits to online advertising.
If all this choice is confusing and you’re desperate to find out the value of
Jousting Sticks we suggest you subscribe to Amazon Prime Video as they have The
Castle.
WHAT'S NEW IN THE MEDIA - FOXTEL
Foxtel
is probably under the most pressure today since their launch in Australia back
in 1995. The enormous competition from the streaming entrants for both
content and lower costs is clearly ramping up. They also lost the contract to
sell Network Ten advertising which they have had since 2015. CBS (Ch10’s
owner) wants to control their revenue and has therefore brought advertising
sales in house.
This may not be such a bad thing as previously Foxtel had a great deal of
trouble selling both Foxtel and Ten particularly given they were operating off
two different sales platforms. This allows Foxtel to concentrate on their own
product and in fact recently they’ve introduced two new sales
initiatives. We can now buy a 6 second ad as part of a “Q Break” on
Foxtel. The Q Break has a 3 sec intro (informing there is a quick ad
break coming), then two six-second ads at the end or start of a program. They
also introduced an “M Break” which is a one minute ad break with only two
advertisers.
Foxtel’s latest announcement is they are closing down their Digital Foxtel Now
platform and hoping to move people over to the Foxtel Go app.
DIGITAL UPDATE

DIGITAL PROGRAMMATIC – BEGINNERS
GUIDE
Programmatic
Digital buying is a buying method that requires a highly sophisticated software
system to manage booking activity on numerous sites, serving the creative to
multiple locations and then paying each site based on its delivery. No
media agency owns this complex software however they use companies that do,
which are known as ‘Demand Side Platforms’ (DSPs). The term ‘Trade Desk’
means the agency buys direct with a DSP which is usually a benefit for clients
as there are less companies adding a service fee.
One of the main benefits of Programmatic activity is the ad placement is
optimised based on a particular interaction such as click through, conversion
on your site, etc all while the campaign is running. Programmatic advertising
has been attractive as it is seen as accountable and usually at a lower cost
than going direct to a particular site.
Unfortunately, in the early days, Programmatic was somewhat abused as some
buyers loaded up the Programmatic rates 100-400% and even at that rate it still
seemed reasonable to clients as it was delivering an accountable outcome
(compared to the higher prices of direct buys). Those days seem to have
gone as clients woke up to what was happening and some of the larger clients
took it in-house. These days clients can expect to pay 18-30% on top of any
Programmatic cost. Within the cost there should also be some “insurance”
costs built in to ensure the ads are viewable and verified (to prevent brand
risk or ad fraud).
SMI suggests digital programmatic spend is around 30% of all Digital
advertising. Programmatic ads can be either Display, Native, Audio or
Video. Interestingly, the Domain website now only accepts Display
advertising if it is booked Programmatically.
SMI UPDATE
The
interim August results are again showing a depressed advertising market. The
August results are showing the market to be back -16.6% although late Digital
bookings should reduce that figure substantially. When Digital is
excluded from the mix the decline from the remaining media is a lesser 10.1%.
All major media are also again reporting lower ad spend so far this month, with
Outdoor back 15.4% after growing a whopping 22% in August last year.
At this early stage SMI is reporting growth from only eight of the 41 product
categories with very significant declines in ad spend seen for Domestic Banks
(so far back 28.9%), Gambling (back 29%) and Retail (-21%).
Over the calendar year the Agency market is back 6.4% from last year’s record
level of $4.6 billion, representing a fall of $298 million.
FAST FACTS
- From 2020 Newsagents will no longer be home delivering newspapers. News & Nine have organised their own distributors to do it
- According to IPSOS - Professions considered untrustworthy by Australians: Politicians (64%), Advertising Executives (55%), Bankers (52%) and Clergy/Priests (42%)
- Dogs vs Cats? 38.7% of Aussies own a dog, 23.6% own a cat
- We all get a free 7 day trial of Apple TV+ from 1st November
- Australia's longest-running newspaper is the Sydney Morning Herald, first published as the Sydney Herald in 1831
- The median income of the ASX 100 company bosses is $4.5 million a year … how do you get one of those jobs?