

PODIUM OF HOPE

After the games were postponed in 2020, it seems this year’s much anticipated 2021 Tokyo Olympic Games will be going ahead, despite the concern of public health authorities.
Although Japan has managed the spread of the Virus better than its counter parts in most of Europe, in only the last few days Japan has yet again declared a state of emergency in some areas. Japan’s borders remain closed to international tourists and there are no signs they will open anytime soon, certainly not until after the Olympics. This means that all spectators will be limited to residents of Japan and over 4 million official tickets have been sold to date. There is still a strong possibility the athletes will be competing in empty stadiums. A stark difference to previous Olympics where the host nation reaps the economic benefits of the influx of tourism income.
For the thousands of athletes, federation officials, support staff and media travelling to Tokyo, the journey starts 14 days before they leave for Japan. They will have to monitor and report health updates on an app for two weeks before they leave and narrow down their list of close contacts, including coaches and teammates. These are the only people with whom they are meant to interact with while in Japan. If they pass their Covid test before departure and on arrival, they will not have to quarantine. Once the Games begin, athletes will be tested at least every four days.
The idea of this year’s Olympics is that it will be a springboard for a ‘podium of hope’, and move out of the Covid era towards some form of new normality. Seven Network will be taking the reigns as the exclusive broadcaster of this historic event beginning 23 July to 8 August. With hours of content across Seven and 7MATE, the coverage on the main channel will only be interrupted by Sunrise, The Chase and 6pm News (which will strongly benefit in ratings from the Olympics hype). One thing worth noting is that for most Australians there is only a 1-hour time zone difference, allowing for prime viewing and no real time constraints. This compares most closely to the Beijing 2008 Olympics where there was only a 2-hour time difference. Seven was the primary broadcaster, although they on-sold coverage of long form sports to SBS. The Opening Ceremony drew an average audience of 3.3mil viewers despite airing from 10pm-2am on a Friday evening. However, for the 2016 Rio Olympics, where there was a vastly different and less convenient time difference of 13 hours, Network Seven still managed to hold a strong network share of 35% during the Olympic period. 9, 10, ABC and Foxtel almost equally split the remaining viewership.
To understand the magnitude of the return of the games, this year the Olympics will probably reach more people than the AFL Grand final for 17 days in a row. Skateboarding and surfing will reach more 16-24’s than YouTube in one month. Despite Network 7 paying $170 million for the broadcast rights of Rio and Tokyo Olympics, Channel 7 claim they will have 38% less ads to give advertisers greater share of voice and cut through. As a rough guide, clients are paying around $6-10million to be an Olympic sponsor on Seven. There are also packages that Channel 7 will put together to suit individual clients’ budgets.
This year’s Olympics will be unique for its Digital streaming capabilities allowing people to watch their sport of choice. Seven has stated that they will be delivering one billion streaming minutes: 3 times more than Rio 2016. Seven is anticipating a reach of 21 million Aussies (up from 17.5 million for Rio) across Broadcast and 8 million unique users through digital streams.
Audience projections will be predominantly based on Rio 2016, combined with rolling weekly audience averages of Q2 surveys as the Olympics approach. Channel 7 is promoting it to be ‘the most accessible games ever’ and is predicting to see a “30% increase in light viewers, 100% engagement increase, p16-39 +170% Peak, +320% Off – Peak and will be holding audience viewing share for 16-17 hours a day”.
Both Nine and Ten will be business as usual throughout the Olympic period, continuing to broadcast Tentpole programming such as The Bachelor, Survivor, Beauty and the Geek and Ninja Warrior.
It will remain to be seen if indeed the event still goes ahead, nevertheless the 11,000 athletes, coaches, international federations, and media networks are still preparing for the most tightly controlled Olympics in modern history.
WHAT’S NEW IN MEDIA – AND THE WINNER IS ………. MORGAN!

After an 8 year tussle, Morgan has once again been appointed (by the news Publishers) to oversee news readership measurement from 1st July.
Established in 1941, Roy Morgan has been producing Readership data since 1974 and was THE currency of the marketplace.. After 39 years measuring readership, a rival print readership currency from IPSOS (called EMMA) was appointed by the print publishers in 2013. In large part, this was due to simmering tensions and decade long feuds between some Newspaper Publishers and Morgan Research. If our memory serves correctly, this was the third or fourth serious attempt to challenge Morgan readership survey (over the past 4 or 5 decades).
Morgan continued to produce their readership figures with large discrepancies between the two companies. EMMA’s readers per copy was 40% higher than Morgan’s (4.2 vs 3) and this naturally resulted in larger readership figures compared to what Morgan was producing. However the vast majority of Media Agencies and ARE Media (previously Bauer) continued to pay for and use the Morgan data. With very few entities paying for EMMA they had to be bankrolled (at some cost) by the publishers.
ThinkNewsBrands (Seven West, News & Nine) have finally thrown in the towel and awarded the contract to Morgan. ThinkNewsBrands must be keen to start afresh with Morgan as they have cut short the existing EMMA contract by 18 months.
EMMA had quite different survey methodology of rolling telephone and online surveys and fused the data with Nielson Online to achieve a ‘total readership’. Why would any Research firm or Media Organization do this one might ask: cost? We have firmly held the view it was distinctly inferior methodology to Morgan. The Nielsen contract has also been rescinded in favour of Morgan doing it all. Morgan is face to face, single source meaning questions are asked of the same individuals to receive a 360 degree view of the consumer. Single source and face to face research is the Gold Standard, the holy grail of research, but time consuming and therefore costly to collect.
ThinkNewsBrands have said, “We have listened to the industry and acknowledge the need to implement a single unified readership metric for Total News, produced by one entity rather than with multiple data sources. The move to a Total News metric brings clarity to the industry as all advertisers, agencies and publishers will now rely on one measurement, approved and used by all parties, enabling better campaign investment decisions through simplified media planning tools.”
The term ‘Total News’ is used to measure readership across the printed and online formats. At this point, it doesn’t mean a lot to advertisers as the publishers sell print and digital advertising separately.
Morgan has won the readership battle however Morgan is considerably more than Readership. It is a 360 snapshot of Consumers total media habits. Plus the product consumption, plus their ownership of goods and services, plus their intention to purchase…plus, plus, plus.
DIGITAL – THE RISE AND RISE OF STREAMING TV

One of COVID’s ‘media’ legacies is that it has continued to propel digital transformation and encouraged the emergence of CTV (Connected TV) and OTT (over-the-top) services. People are watching less linear TV to digitally stream content when and where they want. In the last year, Broadcast Video On Demand (BVOD) has grown 40%+ as people watch the free to air content on 7Plus, 9Now, 10Play, SBS On Demand, etc.
Connected TV refers to a television connected to the internet and can stream various forms of digital video content online, this includes Smart TV’s and standard TV’s connected to the internet through devices such as Chromecast, Roku or Gaming devices. As well as CTV this is done across numerous OTT services which deliver TV content over the internet that can be accessed from any internet capable app or device (i.e. smartphones, tablets, etc.).
The rise of CTV/OTT is opening up digital opportunities for video creative. With an increase in programmatic video, advertising on a Connected TV provides a great chance to reach increasingly engaged audiences with better targeting capabilities than Linear TV. For Linear TV we buy a particular program because of the audience it reaches and mostly measure it in TARPS. For streaming / BVOD we buy an audience on behavioural targeting as well as contextual. It is mostly measured in thousands reached although measurement is also being done in TARPS to align TV and BVOD. The BVOD audience data is derived from people signing in to the various apps. Age and gender is immediately given however over time the publisher’s 1st party data grows as they learn about what customers consume within their ecosystem. At this stage the most accurate targeting is coming from DSP 3rd party data through programmatic buys.
For BVOD viewing, 60% is watched on a TV, 15% on PCs/Laptops, 14% on tablets and 11% on mobiles. Unsurprisingly, BVOD viewing skews to the under 65 audience.
At present, the BVOD viewing experience varies greatly across the publishers with ad placements sometimes clunky and excessive frequency of the same ad in programs. So there still needs a lot of work to be done in that department. On a positive note, there are far fewer ads on BVOD meaning the ads have a greater share of voice within the breaks. Sometimes there are only one or two ads in a break. Clients also do not need to have CAD numbers (ie. approval from anyone) to appear on BVOD.
It is estimated around 10-15% of Television budgets are going into BVOD and once the VOZ measurement system is in place, overall Reach & Frequency will be greatly enhanced. Although BVOD spots are not time stamped (making ROI attribution difficult), BVOD continues to improve on all levels as the stations see the growing financial benefit to them.
SMI UPDATE – MARCH 2021
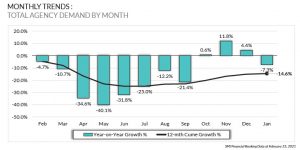
The advertising spend through Media Agencies is no doubt beginning to show signs of improvement when compared to the Covid affected same time last year. March’21 had a total spend of $660 million which is a 2% improvement compared to March’20. The figures for April will be at least a 20%+ increase on same time last year. We probably should not get too excited about huge gains as it is not often the ‘same time last year’ includes a once in a lifetime pandemic. However, it is certainly great news that things are getting back to business as usual.
Similar to February spend, Government advertising spend continued to help March 2021 and was up 48% while In-Home Entertainment was up 71%. With a Jan-Mar increase of 31%, Alcoholic Beverages rounded out the top 3 category increases for the March quarter. Retail is also showing signs of improvement (+13% in March) which is very important as Retail is the largest category along with Automotive Brands.
Digital had the strongest growth (+15.6%) with Social and Programmatic leading the way. Television once again had a strong 7.2% increase with Regional TV increasing by 13.7%. Radio moved into positive territory for the first time in 21 months with a 0.2% increase. Outdoor was -24.6%, Newspapers -28.5%, Cinema -32.2% (half the decline of Feb’21) and Magazines -38.5%.
FAST FACTS
- On average, Sons spend $106 on Mothers’ Day while daughters spend $93
- The Australian Coat of Arms has a Kangaroo and Emu because they can’t walk backwards
- “Mayday”: invented in the 1920s is a phonetic equivalent of the French m’aidez (‘help me”)
- The feeling of getting lost inside a mall is known as the Gruen transfer
- Last Week, the US broadcast of the NFL Player Draft (12.6 Million) outperformed the Academy Awards (9.85 Million) for the first time in history. In Short, the sports program with no sports beat the movie program with no movies.
- The Pringles can inventor (Fredric Baur) is buried in one. That’s dedication!